Hi, what do you want to do?
National Center for Ecological Analysis and Synthesis, University of California Santa Barbara
Kids Do Ecology: Data and Science
Learn about conducting your own investigation with these tips on following the scientific method. Find out how to state hypothesis, make observations, collect and analyze data, and display data to share results and conclusions of your...
NOAA
Noaa: Estuaries: Noaa: Science Data: Graphing
Create graphs of marine ecosystems using real-time data.
Khan Academy
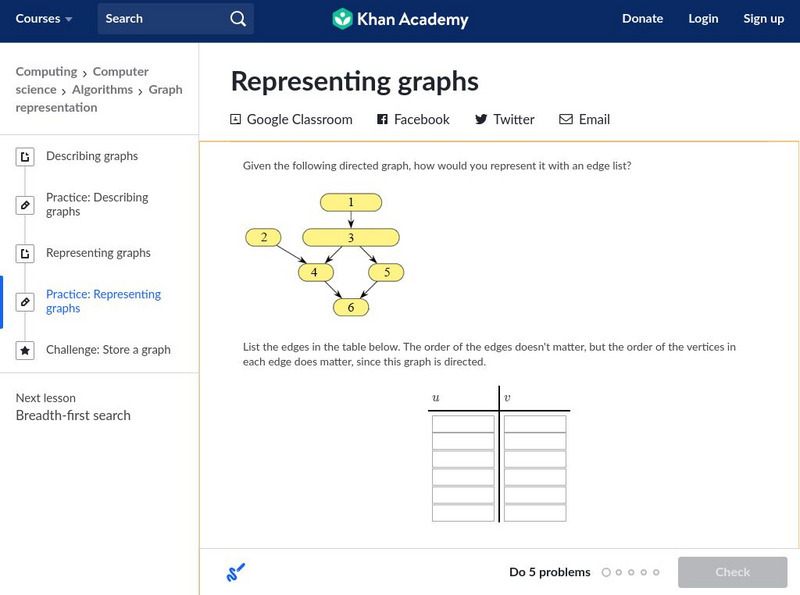
Khan Academy: Representing Graphs
Some practice problems with data and graph representation in computer science.
American Association of Physics Teachers
Com Padre Digital Library: Open Source Physics: Data Tool Program
Use this online data analysis tool to build graphs and display results from scientific investigations. Data can be entered directly with the keyboard or imported from, and exported to spreadsheets.
Khan Academy
Khan Academy: The Sources of Big Data
Sources of big data and the issues of storage are examined.
Texas Instruments
Texas Instruments: Science Today More of u.s.
Students examine the USA TODAY Snapshot "More of U.S.", construct a graph from the data, produce a mathematical model (linear) for the data, determine the rate of change for the data, and make predictions about future population levels.
TeachEngineering
Teach Engineering: Graphing the Spread of Disease
Students simulate disease transmission by collecting data based on their proximity to other students. One option for measuring proximity is by having Bluetooth devices "discover" each other. After data is collected, students apply graph...
Texas Instruments
Texas Instruments: Science Today the Usa's Expanding Weight Problem
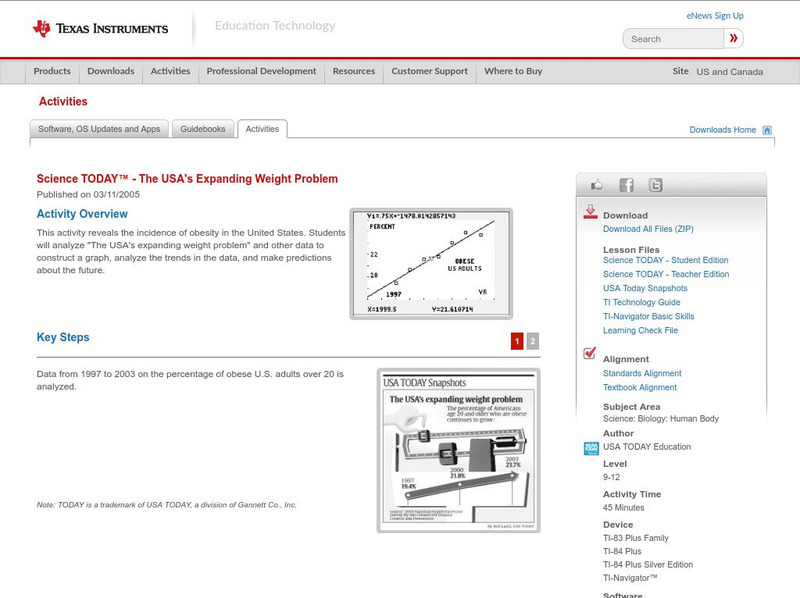
This activity reveals the incidence of obesity in the United States. Students will analyze "The USA's expanding weight problem" and other data to then construct a graph, analyze the trends in the data and make predictions about the future.
Science Education Resource Center at Carleton College
Serc: Using Globe Data to Study the Earth System
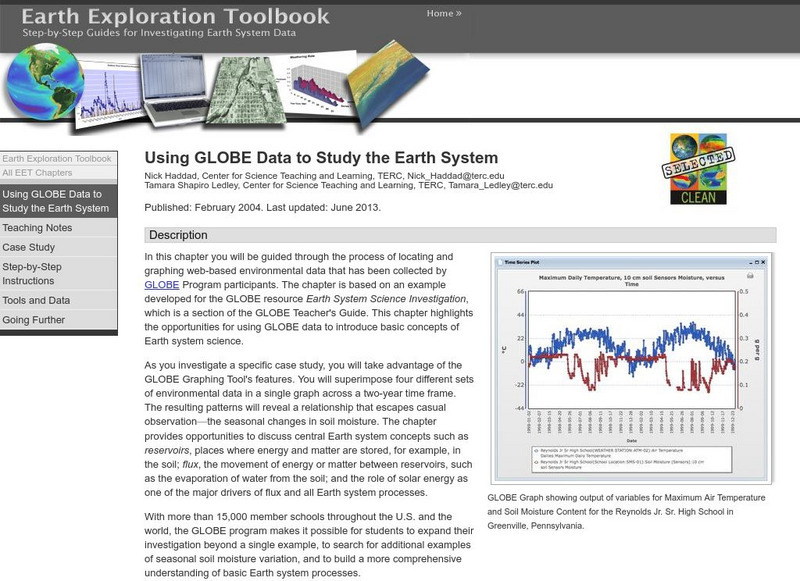
This lesson guides students through the process of locating and graphing web-based environmental data that has been collected by GLOBE Program participants. The lesson provides opportunities for using GLOBE data to introduce basic...
Alabama Learning Exchange
Alex: "Ridin' Along in My Automobile"
Students will research prices of used cars to discover how automobiles lose their value over time. Students will create a chart to record their information, use their chart to graph their data, and find measures of central tendency of...
Other
A River Runs Through It Learning Project
For this year long learning project integrating mathematics and science, students solve environmental problems using data collection and problem solving concepts. Designed for upper elementary gifted students. Interactive components and...
Khan Academy
Khan Academy: Representing Graphs
There are several ways to represent graphs, each with its advantages and disadvantages. Some situations, or algorithms that we want to run with graphs as input, call for one representation, and others call for a different representation....
Khan Academy
Khan Academy: Encryption, Decryption, and Cracking
Julius Caesar encrypted messages two thousand years ago. By knowing the techniques of deciphering a code--frequency analysis, known text, and brute force--one can begin to understand the three key aspects of data encryption, decryption,...
Khan Academy
Khan Academy: Storing Data in Variables
Practice variable assignment in the AP CSP pseudocode, in this set of free practice questions designed for AP Computer Science Principles students.
ClassFlow
Class Flow: Fitting Models to Data
[Free Registration/Login Required] A basic premise of science is that much of the physical world can be described mathematically and many physical phenomena are predictable. This scientific outlook took place in Europe during the late...
Palomar Community College District
Palomar College: Behavioral Science Statistics: Cumulative Percent Polygon
A step-by-step worked problem demonstrating how to take a set of data and produce a cumulative percent polygon. Hints are provided along the way, and the final graph is shown for the user to check.
Palomar Community College District
Palomar College: Behavioral Science Statistics: Frequency Histogram an Example
A step-by-step worked problem demonstrating how to take a set of data and produce a frequency histogram. Hints are provided along the way and the final graph is shown for the user to check.
NASA
Nasa: Why Is Carbon Important?
Students explore the relationship between atmospheric carbon dioxide concentrations and temperature, and how these relate to climate change. Graph and map data are used as evidence to support the scientific claims they develop through...
TeachEngineering
Teach Engineering: Quantum Dots and Colors
Students are introduced to the physical concept of the colors of rainbows as light energy in the form of waves with distinct wavelengths, but in a different manner than traditional kaleidoscopes. Looking at different quantum dot...
PBS
Pbs: Mathline Creature Feature Lesson Plan [Pdf]
An interdisciplinary math, science, and language arts lesson that engages students in an exploration of statistics. Through a study of various forest climates, students utilize data collection and analysis, classification, and graphing....
CK-12 Foundation
Ck 12: Physical Science: Scientific Graphing
[Free Registration/Login may be required to access all resource tools.] Usefulness and types of graphs.


