Curated OER
High Temperature records by State
In this temperatures worksheet, learners view a spreadsheet of the high temperatures of the states and change the data on it using spreadsheet tools. Students complete 4 tasks.
Curated OER
Applied Science - Science and Math Post-Lab
Students explore optical illusions. In this Applied Science lesson, students view optical illusions and record the data of what they see. Students graph the data that they collect.
Virginia Department of Education
Weather Patterns and Seasonal Changes
Get your class outside to observe their surroundings with a lesson highlighting weather patterns and seasonal changes. First, learners take a weather walk to survey how the weather affects animals, people, plants, and trees during...
University of Georgia
Using Freezing-Point Depression to Find Molecular Weight
Explore the mathematical relationship between a solvent and solute. Learners use technology to measure the cooling patterns of a solvent with varying concentrations of solute. Through an analysis of the data, pupils realize that the rate...
Curated OER
Survey of Height
In this data collection worksheet, students survey the heights of their fellow classmates, organize their data in a data table, and create a bar graph from their data. Once bar graph is completed, students complete 2 short answer...
NASA
Write the Book on Weather Metrics
It's not easy to measure the weather. Pupils learn about what all weather has in common—the atmosphere. Scholars discover how a meteorologists must be able to measure aspects of the atmosphere and decipher the data. They then create a...
Curated OER
Comparing Data
Eighth graders create a survey, gather data and describe the data using measures of central tendency (mean, median and mode) and spread (range, quartiles, and interquartile range). Students use these measures to interpret, compare and...
Curated OER
From Playing with Electronics to Data Analysis
Young scholars collect and Analyze data. In this statistics lesson, students identify the line of best fit of the graph. They classify lines as having positive, negative and no correlation.
Curated OER
Data Habitats
Students develop data acquisition skills and quantify descriptive data. In this data lesson students divide into groups and do an activity that shows them why it is important to record data with accuracy and consistency.
Curated OER
Data Analysis
In this data analysis worksheet, 8th graders solve and complete 4 different problems that include determining the line of best fit for each. First, they write the prediction for an equation for each situation described. Then, students...
Curated OER
Creating a Thematic Map
Students create and analyze a weather-related data table and a thematic map based upon information provided.
Curated OER
Are You Full of Hot Air?
Explore the concept of measuring and recording circumference. In this physical science and measurement lesson, young learners blow up balloons, measure the circumference, and record the data on an interactive graphing website.
It's About Time
Mass Extinction and Fossil Records
The focus of a fossil-based lesson uses graphs and charts that allow young paleontologists to make inferences about events of mass extinction. They must apply their previous knowledge about fossil records in this final lesson of the...
It's About Time
Present-Day Climate in Your Community
So what exactly is climate? This first installment of a six-part series introduces the concept of climate using real-world data tables and topographic maps. The timely lesson includes a comprehensive overview of climate, as well as...
Curated OER
Weather Data Analysis
In this weather worksheet, students read a data table comparing the temperature and weather conditions at three different locations. Students use this data to complete 8 fill in the blank, 1 short answer question, and one graph.
Curated OER
Frost Depth Study
Students complete activities to study the frost and frost depth. In this frost study lesson, students use frost tubes to study and measure the frost at their school. Students measure the frost in the tube and enter their data online to...
Curated OER
TV Weather Announcers
Elementary schoolers collect and record weather data for their local area using data from newspapers, Web sites, and television reports. The read and record data daily, and groups prepare a presentation on their findings for the entire...
US Environmental Protection Agency
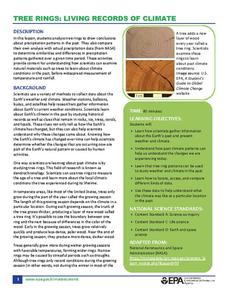
Tree Rings: Living Records of Climate
Open with a discussion on weather and climate and then explain how tree rings can provide scientists with information about the earth's past climate. Pupils analyze graphics of simulated tree rings from various US locations for the...
Chicago Botanic Garden
Weather or Not
What is the difference between weather and climate? This is the focus question of a lesson that takes a deeper look at how weather data helps determine climate in a region. Using weather and climate cards, students decide if a statement...
Virginia Department of Education
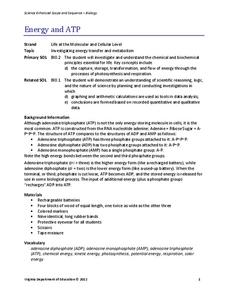
Energy and ATP
Take charge of your biology class by using this exciting analogy to relate the ATP process with batteries. Pupils use batteries and rubber bands to simulate the phosphate bonds between molecules in the body. They measure the distance in...
Curated OER
Missing Macroinvertebrates - Stream Side Science
Field study groups collect samples of stream water and identify the macroinvertebrates found. Using their data, they calculate a water quality index to rate the health of the stream. They graph their data and discuss the value of a water...
NOAA
Climographs
In the second lesson plan of a five-part series, young climatologists use provided temperature and precipitation data to create climographs of three different cities. They then analyze these climographs to develop a general understanding...
Cornell Lab of Ornithology
Investigating Evidence
Explore the scientific process through nature. Scholars become scientists as they develop a question, design an experiment, collect data, and analyze their results. A two-week lesson guides your classes through the process and provides...
NOAA
How Do We Know?: Make Additional Weather Sensors; Set Up a Home Weather Station
Viewers learn about three different weather measurement tools in installment five of the 10-part Discover Your Changing World series. They build weather vanes to collect data on wind speed, barometers to determine air pressure, and rain...


