Achieve
BMI Calculations
Obesity is a worldwide concern. Using survey results, learners compare local BMI statistics to celebrity BMI statistics. Scholars create box plots of the data, make observations about the shape and spread of the data, and examine the...
Statistics Education Web
Double Stuffed?
True or false — Double Stuf Oreos always contain twice as much cream as regular Oreos. Scholars first measure the masses of the filling in regular Oreos and Double Stuf Oreos to generate a class set of data. They use hypothesis testing...
Curated OER
Gauss Law Activity
In this science-related worksheet, students explore and experiment all the sides and views of an infinitely long cylinder with their eyes opened and then closed as they answer twenty four questions.
Corbett Maths
Density
A short video introduces the triangle that illustrates how to find any value given the other two in the density formula. Class members use the triangle to work several problems to find the mass, volume, or density of an object.
Curated OER
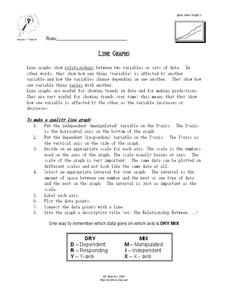
Line Graphs
In this algebra worksheet, students describe the relationship between a line graph and its data. They define the reasons line graphs are used and discuss increasing and decreasing lines. There is one involved questions, requiring several...
Curated OER
Scatter Plots
For this Algebra I/Geometry/Algebra II worksheet, students create a scatter plot and analyze the data to determine if the data show any type of correlation. The four page worksheet provides extensive explanation of topic, step-by-step...
Curated OER
Scatterplots
In this statistics worksheet, students create a scatter plot based on their analysis of data provided form the space shuttle Challenger disaster. The five page worksheet contains four questions. Answers are not provided.
Curated OER
Data Analysis
In this data analysis worksheet, students solve and complete 4 different types of problems. First, they reduce the data provided to find the means, and graph the means in a line graph. Then, students graph the data from each mixture...
Achieve
Rabbit Food
Keep your pets slim, trim, and healthy using mathematics! Pupils use a linear programming model to optimize the amount and type of food to provide to a pet rabbit. They model constraints by graphing inequalities and use them to analyze a...
Achieve
Dairy Barn
Agriculture is truly a math-based profession! Help the dairy farmer determine the supplies needed to complete his barn. Using given dimensions, learners build equations and use units to determine the correct amount of materials.
Curated OER
Paper Helicopters
In this paper helicopter worksheet, students design and experiment making a paper helicopter to explore how some things fall and how varying the size of the rotor blades affect the way a helicopter spins.
Curated OER
Introduction to Mathematical Modeling
In this mathematical modeling activity, students answer two essay questions. They describe Newton's Law of Cooling by describing and constructing a model and answering seven essay questions about the process.
Curated OER
Magnetic Energy
In this magnetic energy worksheet, learners are given the formula to calculate the magnetic energy of an object. They use the formula to solve for the magnetic energy of the Earth, a geotail, the Sun, and a solar prominence given their...
Curated OER
Integration: Statistics, Scatter Plots and Best-Fit Lines
In this math worksheet, students identify the type (if any) of correlation on 6 scatter plots. They use information given on a table to create a scatter plot and identify the type of correlation. Students use the scatter plot to make...
Curated OER
Statistics
In this statistics instructional activity, students view 6 graphs to determine the correlation. Students then answer 4 questions that involve plotting data, determining a relationship, and making predictions.
Other popular searches
- Variables in Science
- Variables Science
- Science Variables Game
- Variables Science Quiz
- Catapults Science Variables
- Practicing Science Variables
- Identifying Science Variables
- Physical Science Variables
- Identifing Science Variables
- Science Variables Worksheets


