Curated OER
Epidemiology: Graphing and Analyzing Health Data
Learners graph data on fetal and infant mortality rates collected by the Centers for Disease Control and Prevention. They identify trends in the data and propose potential causes for the trends.
Alabama Learning Exchange
Weather Detectives
Second graders make weather observations and record data. They use the internet to get data on the weather. After 5 days students predict the weather for the next 3 days.
Curated OER
Predicting the Past
Students study how archaeologists record the past. They discuss archaeology and artifacts. They view a list of artifacts discovered by Marquette at the Illinois Village and answer questions regarding them. They complete a test about...
Curated OER
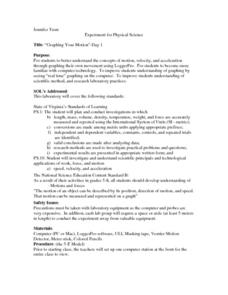
Graphing Your Motion-Day 1
Ninth graders explore the concepts of motion, velocity and acceleration through graphing their own movement using LoggerPro. They become more familiar with the computer technology. Students explore graphing in real time and graph on...
Curated OER
Observing Fruits and Seeds
Third graders discuss what they think the word "observation" means and discover different ways that we observe. They observe as the teacher demonstrates how to use a hand lens as a tool for observing tiny details. They then use hand...
Curated OER
Taking In The Heat
Students discover that different textured materials can absorb more heat than others. Students work with thermometers, clocks, and graphs.
Curated OER
Annotating Change in Satellite Images
Young scholars compare a series of satellite images taken 3-4 years apart to investigate the effects of human land use. They annotate the images using ImageJ software and use the annotated images to explain their findings.


