Earth Watch Institute
Entering Local Groundhog Data in an Excel Spreadsheet
Here is a cross-curricular ecology and technology lesson; your learners create spreadsheets depicting the location and number of groundhog dens in a local park. They research groundhogs and analyze data about where the groundhog...
Houghton Mifflin Harcourt
Simple and Compound Interest
Your learners will get lots of practice calculating simple and compound interest by the end of this lesson. Simple explanations and examples lead learners through the concepts and steps of calculating simple and compound interest...
Curated OER
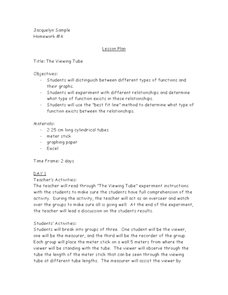
The Viewing Tube
Looking for an excellent lesson that incorporates math, science, and technology? Groups of three students use a viewing tube to perform an experiment, and discover how to organize their data into an Excel spreadsheet. This is a very...
Curated OER
Using Excel To Teach Probability And Graphing
Students engage in the use of technology to investigate the mathematical concepts of probability and graphing. They use the skills of predicting an outcome to come up with reasonable possibilities. Students also practice using a...
Curated OER
Basic Excel
Young scholars explore basic Excel spreadsheets. In this spreadsheet lesson plan, students enter Alaska weather information and perform calculations. Young scholars title the columns on the spreadsheet and format the cells. Students...
Curated OER
Using a Spreadsheet
Students create a spreadsheet to analyze data. In this technology activity, students develop and use an Excel spreadsheet to log their data. They solve real life word problems as they set it up using the spreadsheet.
Curated OER
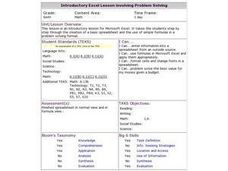
Introductory Excel Lesson involving Problem Solving
Sixth graders analyze an introductory lesson for Microsoft Excel. They go step by step through the creation of a basic spreadsheet and the use of simple formulas in a problem solving format.
Curated OER
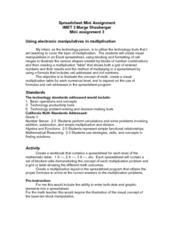
Using Electronic Manipulatives in Multiplication
Factor polynomials using electronic manipulatives. Your class will create a spreadsheet in excel and use it to multiply and perform basic operations and solve problems correctly. They create a visual to go along with each multiplication...
Curated OER
Simple Bar Graphs Using Excel
Pupils create original survey questions, and develop a bar graph of the data on paper. They input the survey data using two variables onto an Excel bar graph spreadsheet.
Curated OER
Cross Cultural Transportation and Resources Exchange
Students examine various modes of transportation. They explore regional transportation options and discover options available in their area. Students survey types of transportation people use in their area. Using spreadsheet data,...
Curated OER
Graphing Pendulum Results
Sixth graders set up a pendulum experiment deciding which variable to manipulate (length of string or weight on the string). They create a hypothesis, collect necessary equipment, and write out each step of their experiment. They then...
Curated OER
Tasty Tech Activity With Excel
Students are introduce to basic Excel skills, rank their opinions of menu items from fast food restaurants, add their answers to the spreadsheet, and then create a simple graph of the results.
Curated OER
Excel temperature Graphs
Learners gather data about the weather in Nome, Alaska. In this Nome Temperature lesson, students create an excel graph to explore the weather trends in Nome. Learners will find the average weather and add a trend line to their graph.
Teach Engineering
Searching for Bigfoot and Others Like Him
Individuals create a GIS data layer in Google Earth that displays information about where one might find seven different cryptids. The class members research to find data on cryptid sightings they can include in their data layer.
Curated OER
Three Squirrels and a Pile of Nuts
Learners solve story problems using a spreadsheet in combination with various problem-solving strategies. Working in teams of three, students create attempt to solve a story problem using three different methods; using manipulative,...
Curated OER
Hopes and Dreams: A Spreadsheet Lesson Using Excel
Fourth graders read "The Far Away Drawer" by Harriet Diller and discuss the story as a class. After discussion, 4th graders create a t-shirt GLYPH about their hopes and dreams,share their information with the class and create spreadsheets.
Curated OER
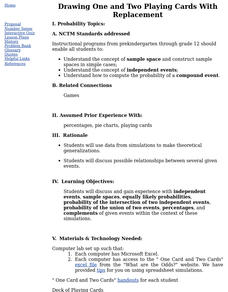
Drawing One and Two Playing Cards With Replacement
Math whizzes use data from simulations to make theoretical generalizations and discuss possible relationships between several given events. They use a simple card game to generate data to be analyzed.
Curated OER
Math Operations/Formulas
Students discuss the ways spreadsheets can help them solve story problems. In groups, they must set up a spreadsheet with the correct formulas based off of different scenerios using the correct order of operations. To end the lesson,...
Curated OER
Three Squirrels and a Pile of Nuts
Learners solve word problems using a spreadsheet, strategies, and algebraic variables. They disuss the given problem, which can be printed, write the unknowns, and employ the strategies into a spreadsheet. Students then use Microsoft...
Curated OER
Aerospace Engineering
Twelfth graders examine the physics of rocket flight. They build and launch model rockets to measure their performances.
Curated OER
Star Light...Star Bright
In this brightness of stars learning exercise, high schoolers use a given formula using the temperature in Kelvins of a star to find its brightness. Students solve 4 problems using this equation.
Curated OER
Favorite Foods at Thanksgiving
Fourth graders study different types of graphs as a means of displaying information. They survey others to find their favorite Thanksgiving food and then graph the results using different types of graphs.
Curated OER
Weather, Weather, Everywhere!
Sixth graders collect weather data to compare temperatures around the world. Using the Internet, learners collect data, put it into spreadsheets, and analyze and graph the results. An interesting way to cover the topic of weather.
Curated OER
Enhancing Writing Through Technology
Students participate in a class survey of their favorite activity to do in the snow and organize the results in a graph. They write a paragraph about the graph using language from a class-developed word web and include both an opening...


