Scholastic
Study Jams! Find Probability
Sam bought tickets for a school raffle and wants to know if he has a good chance of winning. Help him find out with this step-by-step presentation on basic probability. Examples clearly model how to find the probability of simple events...
Scholastic
Study Jams! Probability as a Fraction
Pick a card, any card... and then follow along with this step-by-step presentation as Sam from the Study Jams! crew determines what chance he has of drawing a jack from a deck of cards. This context serves to clearly model how fractions...
Shodor Education Foundation
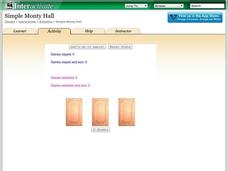
Simple Monty Hall
What's behind door number one? A fun resource lets learners simulate the classic Monty Hall probability problem. Pupils choose a door, and after they select a losing door, they decide whether to switch or stay. Using their decisions, the...
CK-12 Foundation
Venn Diagrams: T-Shirt Mystery
Sorting your t-shirts is easy with Venn diagrams. Individuals use a drag and drop interactive to classify shapes on t-shirts into Venn diagrams. A set of challenge questions tests whether the classification is correct.
CK-12 Foundation
Sex-Linked Inheritance
Sex-linked traits indicate a gene's location on a specific chromosome. Scholars learn about sex-linked traits and the specifics behind color blindness in the videos. Then they complete the online interactive to apply their knowledge...
Shodor Education Foundation
Rabbits and Wolves
A change in a parameter can end in overpopulation. The resources gives pupils the opportunity to control the parameters of rabbits and wolves in a natural setting. Using the set parameters, the simulation runs and displays the population...
Curated OER
Working with Frequency Tables
In this Working with Frequency Tables activity, students analyze data that is organized in simple frequency charts. They calculate average from data presented in a frequency table, calculate a cumulative score, and identify data...
McGraw Hill
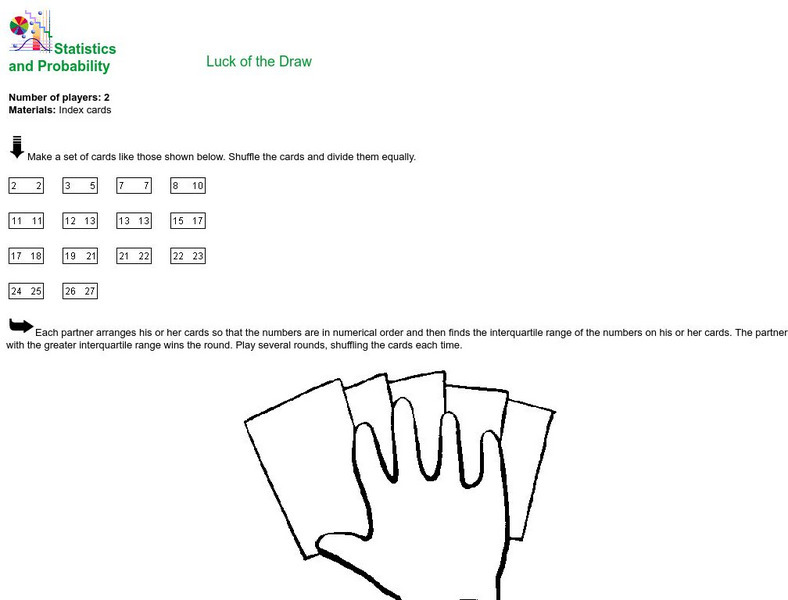
Mc Graw Hill Education: Glencoe: Statistics and Probability: Luck of the Draw
Instructions for creating and playing a simple card game through which students can practice calculating the interquartile range from a set of numbers.


