Curated OER
Be the Kiwi
Young scholars analyze linear equation. In this algebra activity, students analyze and graph data. They solve problems involving linear equations and graph lines using the slope and y intercept.
Curated OER
Graphing Data
Young scholars graph lines in a coordinate plane. In this geometry lesson plan, students graph lines on a coordinate plane, and identify the slope. They calculate the volume, area and perimeters of the shapes created on a coordinate plane.
Curated OER
Solving Two Step Equations
In this algebra worksheet, students solve linear equations using the slope and y-intercept. They solve word problems using algebra. There are 9 questions with an answer key.
Curated OER
Basic Equations
Ninth graders solve basic equations. In this algebra lesson, 9th graders solve linear equation using addition, subtraction, multiplication and division. They solve two step equations isolating the variable and putting the equation in the...
Curated OER
Points as solutions
Ninth graders graph linear functions using coordinate points. For this algebra lesson, 9th graders plot points and graph a line. They use the slope intercept form to graph their equation and evaluate points as solution to the function.
Curated OER
Graph a Situation Without a Table
Students graph an equation without a table. In this algebra lesson, students are given rate or time and asked to graph a line at the starting rate. They use the slope intercept form to decipher the word problem and graph the line.
Curated OER
Practice Graphing y = mx + b
Ninth graders graph linear equations of the form y= mx + b. In this algebra lesson plan, 9th graders are able to graph a line given the slope and y-intercept. They can write the equations of a line given the graph of a line and can...
Curated OER
Review of Linear Graphing
Young scholars graph linear equations. In this algebra activity, students create tables from an equation and plot their points. They graph the equation using the slope and y-intercept. They rewrite word problems using linear equations to...
Curated OER
Writing equations for the picture project
Learners write equations for their graphs. For this algebra lesson, students analyze graphs after they plot them using coordinate points and write an equation for the line given the slope and y-intercept. They express their answers using...
Curated OER
Graphing Standard Form Inequality
Young scholars solve equations and graph it. In this algebra instructional activity, students solve inequalities and rewrite them in the slope intercept form. They graph the boundary lines first either as dashed or solid and shade the...
Curated OER
Introduction of Single and Multiple Linear Inequalities
Students solve linear inequalities. In this algebra lesson, students rewrite inequalities using one and two step equations. They graph their findings and identify the slope and solution of the line.
Curated OER
Graphing Your Motion with Vernier LabQuests
Seventh graders create motion graphs using a motion sensor. In this physics lesson, 7th graders match the graph shown by moving their body. They relate the slope to the way they moved.
Curated OER
Multiplying Monomials
Students differentiate between linear and quadratic functions. For this algebra lesson, students write equations of graphs and graph a function from an equation. They also identify the slope and y-intercept.
Curated OER
Approximation of Pi
High schoolers explore the concept of Pi. In this Pi lesson, students measure the circumference and diameter of a circle. High schoolers record the diameter and circumference measurements from their classmates. Students...
Curated OER
Midsegments of Quadrilaterals
High schoolers explore the concept of quadrilaterals as they find the midsegments of quadrilaterals using Cabri Jr. on a graphing calculator. They find midpoints, slopes, angles, and distances of lines and angles.
Curated OER
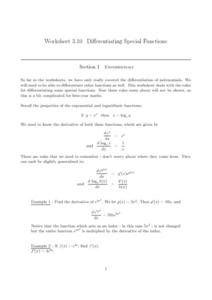
Differentiating Special Functions
In this differentiating special functions worksheet, learners solve and complete 5 various types of problems. First, they differentiate each of the given functions. Then, students complete the table using a calculator and plot the points...
Curated OER
New York State Testing Program
In this math worksheet, students review concepts in algebra and geometry in preparation for the State Exam. They review slopes and functions, area and perimeter. There are 27 questions.
Curated OER
Regents Exam
In this math instructional activity, students perform basic operations all the way up to precalculus. They graph, identify slopes, plot data and analyze it. There are 34 questions.
Curated OER
Parallel Lines Worksheet
In this algebra worksheet, students find the equation of a line, given a point and a slope. They find lines that are parallel to the given equations. There are 6 questions.
Curated OER
Graphs and Direct Variation
Students solve problems with direct variation. In this algebra lesson, students analyze graphs to figure out the direct variation of a line. They observe the slopes based the steepness of the lines.
Curated OER
Glacier Dynamics
Students create flubber glaciers. In this glacier dynamics lesson, students experiment factors that may affect glacier speed. Factors include slope, ice temperature, and basal conditions. Students develop hypothesis, conduct experiment,...
Curated OER
Local Linearity
In order to investigate local linearity, students graph the function on the TI-calculator and zoom to observe the change in slope on the line. They incorporate technology to visualize these problems.
Curated OER
Using Tables to Solve Linear Functions
Oh that intercept! Budding algebra masters solve linear equations from standard to intercept form. They identify the slope and y-intercept to help graph the lines, an then create coordinate pairs using a table of values. Great TI tips...
Curated OER
Cardiac Hill
Students calculate pulse rates to determine level of exertion. In this human body lesson, students hike up a hill or steep slope and take their pulse. Students observe their breathing and energy level then record data.
Other popular searches
- Slope Intercept Form
- Slope of a Line
- Slope and Y Intercept
- Finding Slope
- Slope Intercept
- Algebra Projects on Slope
- Point Slope
- Point Slope Form
- Slope Rate of Change
- Slope Formula
- Slope Intercept Form
- Point Slope Formula


