Curated OER
Are We Sure They Are Parallel?
Fourth graders explore the definition and properties of parallel lines. This high level lesson has students calculate the slope of the two parallel lines, and draw the lines on a Caretsian coordinate system.
Curated OER
Activity #3 Finding Mass
Students use graph paper to construct a graph and determine the slope of a straight line. They determine the weight (mass) of paper clips with a pan balance. Pupils weigh an unknown number of paper clips, and to interpret the graph to...
Curated OER
Graphing Linear Equations Using Data Tables
Learners review the Cartesian plane and the process of plotting points. In groups, students create tables, identify the slope and y-intercept, and graph the equation. Afterward, learners perform the same process, only, individually. As a...
Curated OER
Linear Equations Data Tables
Students graph linear equations on a Cartesian plane. After describing data tables and their use, students explore how the information from a table can be used to create a line graph. They discuss reasons for plotting a minimum of...
Curated OER
Coffee: Differential Equation
In this differential worksheet, students read a word problem and write a differential equation and solve it. They draw the slope field for given problems. This two-page worksheet contains 9 multi-step problems.
Curated OER
Circles Minilab
Students learn how to measure the diameter and circumference of a circle. In this circle instructional activity, students organize their data to create a graph. Students utilize their graph to make an inference about the slope of pi.
Curated OER
Graphing Linear Functions Three
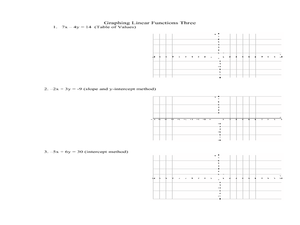
In this algebra worksheet, students are given an equation and asked to create a table of values and graph their equation. The other method they use for graphing is the slope intercept method, by solving the equation for y and identifying...
Curated OER
Whose Line is it Anyway?
Students solve systems of equations. For this algebra lesson, students identify the domain and range of each function. They use the slope and y-intercept to graph each line.
Curated OER
Accumulation Functions as Antiderivatives
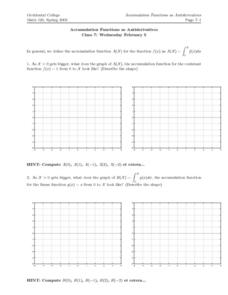
In this accumulation functions worksheet, students describe the graph of an accumulation function for a constant function. Students describe the link between the slope of the graph of the accumulation function and the value of the function.
Curated OER
The Extraordinary Life of the Alaskan Tundra
Students investigate the characteristics of the tundra on the North Slope of Alaska. They conduct Internet research, develop a chart of the types of vegetation, plant growth, and fauna found on the tundra, identify examples in their own...
Curated OER
Finding the Distance and Midpoint of a Line Segment
Students use the Pythagorean formula to find the length of a line. Afterward, they explore the midpoint formula to determine the midpoint of a line with a non-zero slope on a coordinate plane. Students complete assigned problems and...
Curated OER
Active Wear
Middle schoolers interpret and analyze data. In this middle school mathematics lesson plan, students conduct an experiment in which they investigate which solar collector, black, white, or silver, absorbs the most heat. ...
Curated OER
Families of Functions
Students investigate families of functions. In this families of functions activity, students discuss how changing a functions parameters affect its' graph. Students vary slope and y-intercepts of linear functions. ...
Curated OER
Rising Water
Eighth graders discuss a situation with quantities that relate in a linear fashion. They discuss ways to determine the relationship. Students represent this relationship with mathematic symbols. Students discuss the meaning of...
Curated OER
Worksheet 24 - Fall 1995
In this math worksheet, learners find an equation of a curve such that the slope at the point (x, y) on the curve is 3x2 +2 and (−1, 1) is a point on the curve.
Curated OER
Types of Volcanoes
In this volcano learning exercise, students identify various aspects of volcanoes including identifying the types of volcano, the types of lava, the types of eruption, the locations of the volcanoes and the slopes of the volcanoes.
Curated OER
Problem Solving: Graphing Functions
In this graphing functions worksheet, students solve 6 word problems, finding ordered pairs, missing coordinates and numbers, slopes of lines and functions.
Curated OER
Coordinates and Equations
In this algebra worksheet, students solve linear equations and plot their results on the coordinate plane. There are 20 problems using slopes and intercepts to help graph linear equations.
Curated OER
Linear Equations
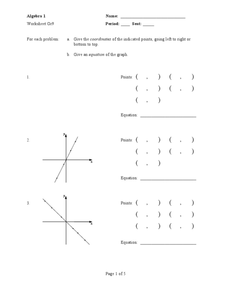
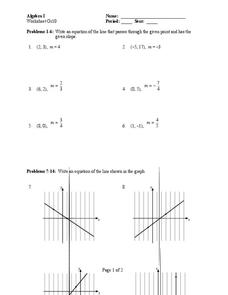
In this Algebra I activity, 9th graders write the equation of a line given a point and the slope and write the equation given a graph. The two page activity contains fourteen problems. Answers are not provided.
Curated OER
Graphing Linear Equations with Calculator
Students graph lines using the calculator. In this algebra lesson, students graph lines of equations in the form y=mx+b. They input equations into the TI Calculator and graph using the slope and intercept. They analyze the graph for...
Curated OER
Graphing Linear Equations on the TI
Learners graph linear equations on the TI calculator. In this algebra lesson, students rewrite equations in the slope intercept form and use the calculator to graph their problem. They work together to interpret the graphs off of the TI.
Curated OER
Solving Systems of Linear Equations Graphically
Students solve systems of equations graphically. In this algebra lesson, students find the point of intersection of two lines if they are not parallel. They rewrite the equation in the y=mx + b form and graph using slope and intercept.
Curated OER
This Building is Tall
Students calculate the perimeter of shapes. In this geometry lesson, students relate properties of polygons to the real world. They find length, midpoint and slope.
Curated OER
CSI Investigation
Young scholars solve real life situation using the Pythagorean Theorem. In this geometry lesson, students calculate the length, midpoint and slope of segments. They solve word problems using properties of square roots.
Other popular searches
- Slope Intercept Form
- Slope of a Line
- Slope and Y Intercept
- Finding Slope
- Slope Intercept
- Algebra Projects on Slope
- Point Slope
- Point Slope Form
- Slope Rate of Change
- Slope Formula
- Slope Intercept Form
- Point Slope Formula
