Curated OER
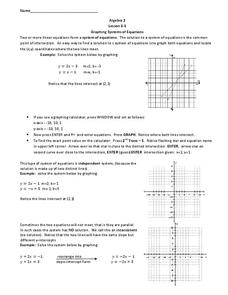
Graphing Systems of Equations
In this Algebra II instructional activity, 11th graders use graphing to determine the solution to a system of linear equations. The two page instructional activity contains explanation and three guided problems. Answers are not included.
Curated OER
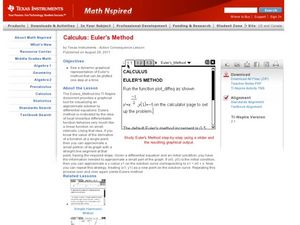
Euler's Method
Learners identify Euler's method of graphing in this calculus lesson. They approximate values of a function and check their work using EM. They also differentiate equations at an exact point.
Curated OER
Price of Apples- Linear Data
Students collect data and create a graph. In this algebra lesson, students describe functions graphically, algebraically and verbally. They identify functions as being independent and dependent using variables.
Curated OER
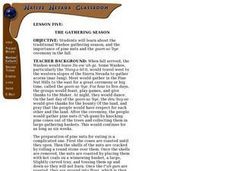
The Gathering Season
Students examine the traditional Washoe gathering season, and the importance of pine nuts and the goom-sa-'bye ceremony in the fall. They roast pine nuts and dance a traditional circle dance. They explore some of the Washoe vocabulary...
Curated OER
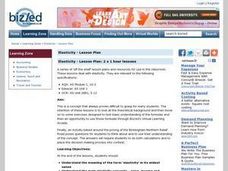
Economics: Elasticity of Prices
Students discover the elasticity concepts of price, income, cross elasticity, and elasticity of supply. They apply this knowledge to an activity about Britain's Birmingham Northern Relief Road.
Curated OER
Linear and Quadratic Approximations
Students explore a linear, a parabolic, and a log function. For this Algebra II/Pre-calculus lesson students investigate the graph a line, a parabola, and a log function. Students examine the three graphs as they compare and contrast...
Curated OER
Population: Logistically Speaking
For this population worksheet, students read word problems relating to population growth. They write the problem as a differential equation, create models and graphs of the solution. This three-page worksheet contains 10 multi-step...
Curated OER
Practice Exercises in IT Skills Pack 4: Presentation Graphics
Learners explore how to annotate and align clip art as well as create Powerpoint presentations. In this presentation graphics instructional activity, students expand their IT skills set by completing 4 projects employing clip art and...
Curated OER
Twelve Facts About e
In this e worksheet, students are presented with several facts about e and Euler. Students are also given a technique to help them remember the numerical approximation for e.
Curated OER
Not Only a Drought
Students explore the events that occurred during the Dust Bowl and differentiate between the good and bad agricultural practices. For this Dust Bowl lesson students participate in activities that shows them how to be good stewards of...
Curated OER
A.P. Calculus Exam Prep
In this A.P. Calculus exam practice test, students answer 28 multiple choice questions. Questions cover a wide variety of topics. Students tell the position of a particle moving along a horizontal line. They identify the solution to a...
Curated OER
Production Possibilities & Opportunity Cost
For this economics worksheet, 12th graders respond to 15 multiple choice questions about production possiblities and opportunity costs.
Curated OER
Exchange Rate Problems
In this economics worksheet, students respond to 10 short answer and multiple choice questions about exchange rates throughout the world.
Curated OER
Optimization For Breakfast
Students identify he proportion of a cereal box. In this algebra lesson, students define the relationship between patterns, functions and relations. They model their understanding using the cereal box.
Curated OER
Conductivity of salt Solutions
Students investigate the concentration level of solutions. In this math/science lesson, students identify three different ionic compounds. They predict the conductivity of each using their collected data.
Curated OER
Slip Slide'n Away
Students analyze the sliding of boxes along a warehouse floor. In this algebra lesson, students connect math and physics by calculating the friction created by the sliding of each box. They develop faster method to move the box, based on...
Curated OER
Quadratic Equation Calculator
For this Algebra II worksheet, 11th graders use an online quadratic equation solver to find the zeros of a quadratic. The one page interactive worksheet provides one worked example and the equation solver.
Curated OER
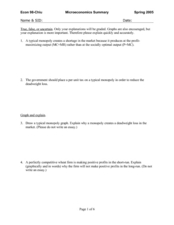
Microeconomics Summary
Twelfth graders study microeconomics. In this Economics lesson, 12th graders draw graphs on government taxes. Students decide if these graphs are true or false.
Curated OER
High School Mathematics Problems from Alaska: Reading a Graph: Azimuth Range vs. Day in Barrow, Alaska
Students focus on reading and interpreting information from a graph.
Curated OER
Graph Of The Derivative
Students engage in a lesson plan that is concerned with defining and drawing the graph of a derivative. The lesson plan includes a definition and examples to lead them away from any misconceptions. They graph derivatives using examples...
Curated OER
Calculus
Students make an inquiry with the aid of technology into the concept of functions. The emphasis of the lesson is on the interplay between the geometric and analytic information.
Curated OER
Viewing Tubes
Middle schoolers complete a lab in order to discover if the length of a viewing tube, its diameter, or the distance from an object affect the type of data collected and the resulting graph.
Curated OER
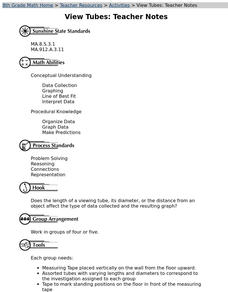
View Tubes
Eighth graders decide if the length of a viewing tube, its diameter, or the distance from an object affects the type of data collected and the resulting graph through a series of experiments.
Curated OER
Exploring the Landscape
Students determine the monotonicity and concavity properties of a function, then apply the First Derivative Test and draw conclusions about the first and second derivatives from these properties.


