Math Graphs
Houghton Mifflin: Math Graphs: Average Rate of Change 3 [Pdf]
The handout explores the relationship between the average rate of change and the slope of the tangent line. The exercise is available in PDF format.
Math Graphs
Houghton Mifflin: Math Graphs: Average Rate of Change 2 [Pdf]
Students use a given graph to investigate the average rate of change and slope of the tangent line. The practice problem is available in PDF format.
Sophia Learning
Sophia: Slope and Constant Rate of Change: Lesson 3
This lesson explains how slope is related to constant rate of change for linear functions. It is 3 of 5 in the series titled "Slope and Constant Rate of Change."
Texas Instruments
Texas Instruments: Animal Skin Adventure 6
In this adventure, students make two models to simulate the cooling rate of different skin surface areas and determine the effect of skin surface area on the results. Students graph temperature as a function of time, interpret, and...
Other
Nearpod: What Is Slope?
In this activity on slope, students explore how the rate of change can be identified using a graph, a set of points, and a table.
Texas Instruments
Texas Instruments: Math Today for Ti Navigator System More of u.s.
Using the USA TODAY Snapshot, "More of U.S.," students will learn how to interpret data presented in a graphical form. Students will determine the rate of change (slope) and build a linear model (y = mx + b) from this data. The model...
University of Colorado
University of Colorado: Ph Et Interactive Simulations: Ph Et: Function Builder
Play with functions while you ponder Art History. Explore geometric transformations and transform your thinking about linear functions, then have fun figuring out the mystery functions.
Texas Instruments
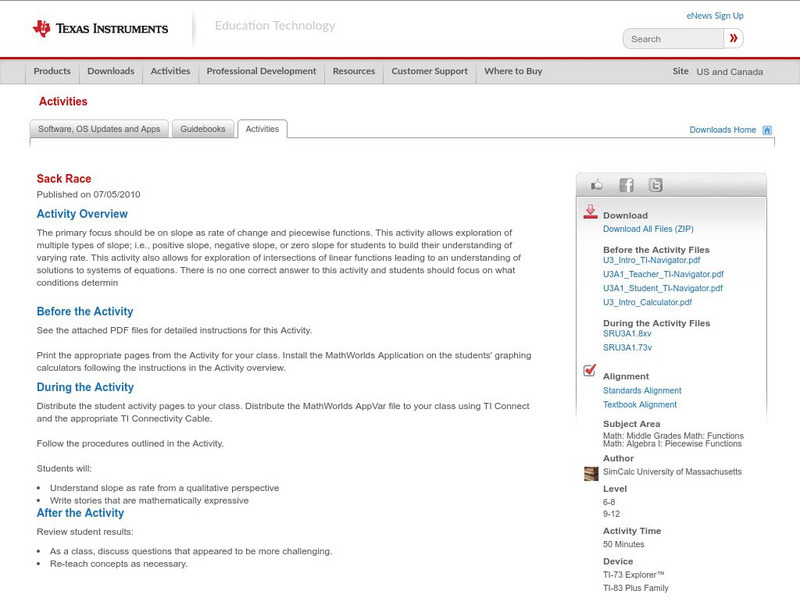
Texas Instruments: Sack Race
The primary focus should be on slope as rate of change and piecewise functions. This activity allows exploration of multiple types of slope; i.e., positive slope, negative slope, or zero slope for students to build their understanding of...
Math Graphs
Houghton Mifflin: Math Graphs: Differential Equation and Slope Field [Pdf]
Students use a given differential equation and slope field to answer questions regarding the general solutions and rate of change of the differential equation. The exercise is available in PDF format.
PBS
Pbs: Modeling the Linear Relationship Between Fahrenheit and Celsius
Explore the relationship between degrees Fahrenheit and degrees Celsius. This video focuses on developing an expression to model the relationship between the temperature scales using a line graph to calculate slope and the y intercept.
Texas Instruments
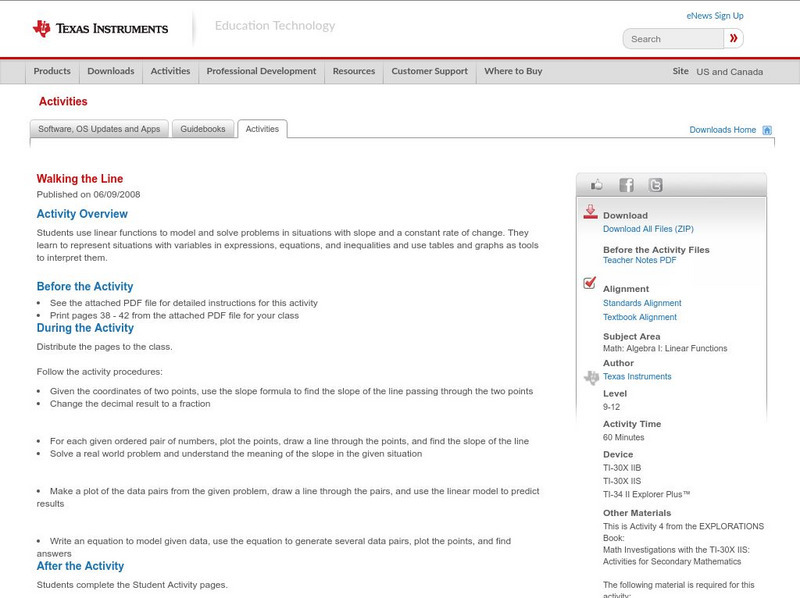
Texas Instruments: Walking the Line
In this activity, students use linear functions to model and solve problems in situations with slope and a constant rate of change. They learn to represent situations with variables in expressions, equations, and inequalities and use...
Texas Instruments
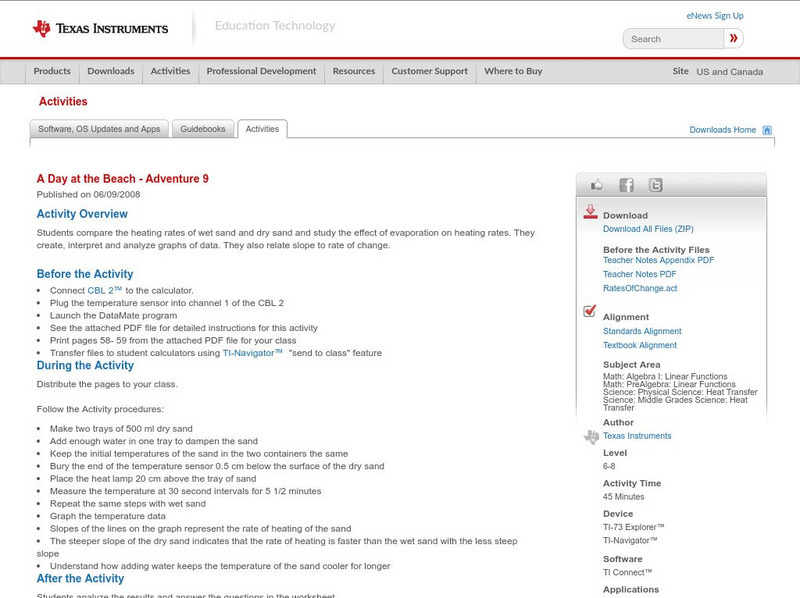
Texas Instruments: A Day at the Beach Adventure 9
Students compare the heating rates of wet sand and dry sand and study the effect of evaporation on heating rates. They create, interpret and analyze graphs of data. They also relate slope to rate of change.
Texas Instruments
Texas Instruments: Active Wear Adventure 10
In this adventure, students test which solar collector--black, white, or silver-- absorbs the most heat. They compare the difference between absorption and reflection. They create, interpret and analyze graphs of data. They also relate...
Texas Instruments
Texas Instruments: A Sweet Drink Adventure 7
Students determine how the temperature of water affects the dissolving time of a sugar cube. They create, interpret and analyze graphs of data, find an equation of the line of best fit, and relate slope to rate of change.
Illustrative Mathematics
Illustrative Mathematics: 8.ee Stuffing Envelopes
Eighth graders are asked to compare the income earned from two summer jobs stuffing envelopes. They are to draw graphs, write equations, and interpret the graphs. This task provides students with an opportunity to take the step from unit...
Sophia Learning
Sophia: Slope Intercept Form and Direct Variations
This lesson relates slope-intercept form to slope and direct variations.
Anne Arundel Community College
Anne Arundel Community College: Math 131: Slope
The tutorial examines the slope of a line. Students learn about the mathematics concept through definitions and detailed examples.
Math Medics
S.o.s. Math: The Derivative
This lesson does a nice job of clarifying what it means to find a derivative. The lesson gives an algebraic method for finding the derivative using limits and offers a geometric interpretation of the derivative.
Texas Instruments
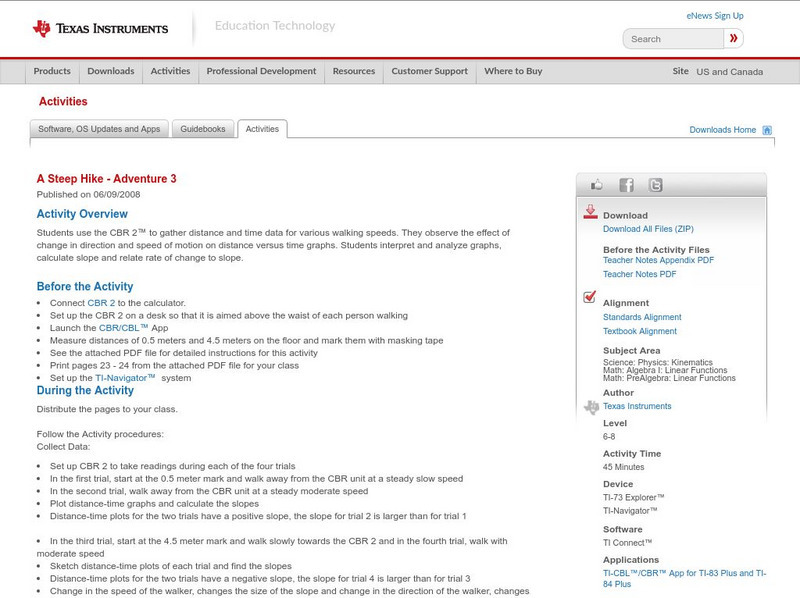
Texas Instruments: A Steep Hike Adventure 3
Students use the CBR 2 to gather distance and time data for various walking speeds. They observe the effect of change in direction and speed of motion on distance versus time graphs. Students interpret and analyze graphs, calculate slope...
Texas Instruments
Texas Instruments: Math Today for Ti Navigator System: More Students Apply Early
Using the USA TODAY Infograph, "More students apply early," students will explore scatter plots and independent and dependent variables. Students will determine a best-fit regression model for the real-life data set and then use the...
PBS
Pbs: The Lowdown: Analyzing Functional Relationships: An Equitable Society?
In this interactive, explore data presented in a series of graphs to evaluate whether we are any closer to having an equitable society than we were in 1963, the year of the historic March on Washington. In the accompanying classroom...
Illustrative Mathematics
Illustrative Mathematics: 8.f Downhill
In this task, a car is traveling down a steep hill. Students are given the function for elevation versus distance from the start and are asked to find and explain the slope and intercepts of the graph. Aligns with 8.F.B.4.
Alabama Learning Exchange
Alex: Graphing Is Great!
Students will explore graphing individually and in groups. They will also use an interactive activity to discuss slope and intercepts. To assess the lesson, students will use the floor tiles in the classroom as a large sheet of graph...
PBS
Pbs: The Lowdown: Poverty Trends: What Does It Mean to Be Poor in America?
Use math to learn about changes in US wealth distribution and poverty rate over time in this interactive from KQED. In the accompanying classroom activity, students interpret the graphs and consider how the poverty rate spike following...
![Houghton Mifflin: Math Graphs: Average Rate of Change 3 [Pdf] Unknown Type Houghton Mifflin: Math Graphs: Average Rate of Change 3 [Pdf] Unknown Type](https://static.lp.lexp.cloud/images/attachment_defaults/resource/large/FPO-knovation.png)


