Illustrative Mathematics
The Intersection of Two Lines
Here is an introduction to solving simultaneous linear equations. Start by drawing a line through two points. Create a second line which goes through the intersecting point. Background knowledge of how to find the equation of a line and...
EngageNY
Some Facts About Graphs of Linear Equations in Two Variables
Develop another way to find the equation of a line. The lesson introduces the procedure to find the equation of a line given two points on the line. Pupils determine the two points from the graph of the line.
Curated OER
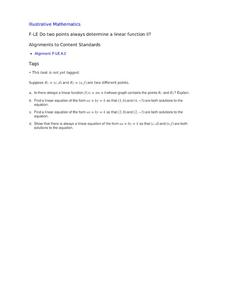
Do Two Points Always Determine a Linear Function II?
Learners analyze the difference between the slope intercept and standard forms of a line in this task. Given two general points using letters they explore linear functions and linear equations.
Illustrative Mathematics
Two Lines
Here is a resource that helps your algebra learners understand the connection between the graph of two lines, the equations of lines, and the solutions and intersecting points of lines. It would make a great assessment question, but can...
West Contra Costa Unified School District
Point-Slope Application Problems
Create a linear equation for a problem when the intercept information is not given. The two-day lesson introduces the class to the point-slope form, which can be used for problems when the initial conditions are not provided. Pupils...
Illustrative Mathematics
Find the Change
This exercise is an opportunity for algebra learners to understand the connection between the slope of a line and points found on the line. Use similar triangles to explain why slope m is the same between any two points. Discuss with the...
Illustrative Mathematics
Comparing Speeds in Graphs and Equations
Compare two different proportional relationships on a graph. It is up to your mathematicians to determine which of two moving objects have greater speed. A good example of a Common Core multiple choice question.
EngageNY
The Slope of a Non-Vertical Line
This instructional activity introduces the idea of slope and defines it as a numerical measurement of the steepness of a line. Pupils then use the definition to compare lines, find positive and negative slopes, and notice their...
Inside Mathematics
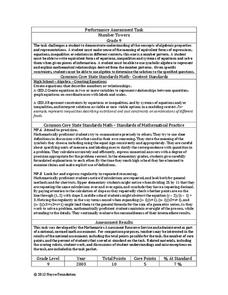
Number Towers
Number towers use addition or multiplication to ensure each level is equal. While this is common in factoring, it is often not used with algebraic equations. Solving these six questions relies on problem solving skills and being able to...
EngageNY
There is Only One Line Passing Through a Given Point with a Given Slope
Prove that an equation in slope-intercept form names only one line. At the beginning, the teacher leads the class through a proof that there is only one line passing through a given point with a given slope using contradiction. The 19th...
Illustrative Mathematics
Telling a Story With Graphs
Turn your algebra learners into meteorologists. Students are given three graphs that contain information about the weather in Santa Rosa, California during the month of February, 2012. Graph one shows temperatures, graph two displays the...
Balanced Assessment
All Aboard
Pupils must graph the location of a train using the time given a timetable. They analyze the different legs of the trip, graph the return trip, and compare the two graphs. The lesson ends with a discussion of similarities and...
Charleston School District
Pre-Test Unit 4: Linear Funcitons
Let your classes show you what they know! Use this pre-test to assess the current knowledge of your learners. The assessment includes all pre-algebra concepts related to functions: writing and graphing linear relationships, comparing...
Concord Consortium
Shooting Arrows through a Hoop
The slope makes a difference. Given an equation of a circle and point, scholars determine the relationship of the slope of a line through the point and the number of intersections with the circle. After graphing the relationship, pupils...
Inside Mathematics
Graphs (2007)
Challenge the class to utilize their knowledge of linear and quadratic functions to determine the intersection of the parent quadratic graph and linear proportional graphs. Using the pattern for the solutions, individuals develop a...
Curated OER
Linear and Quadratic System
Learners find the common point of a linear and quadratic system given a graph of the system. Then they find a specific point located only on the parabola.
Charleston School District
Review Unit 8: Geometry Applicaitons
Pupils complete a review worksheet that highlights the key problems from the first eight lessons in the series. Topics include the Pythagorean Theorem and its converse, as well as finding volume of three-dimensional figures.
Curated OER
Taxi!
Your young taxi drivers evaluate and articulate the reasoning behind statements in a conceptual task involving linear data. The given data table of distances traveled and the resulting fare in dollars is used by learners to explore...
Noyce Foundation
Truffles
Knowing how to scale a recipe is an important skill. Young mathematicians determine the amount of ingredients they need to make a certain number of truffles when given a recipe. They determine a relationship between ingredients given a...
Illustrative Mathematics
Introduction to Linear Functions
Introduce your algebra learners to linear and quadratic functions. Learners compare the differences and relate them back to the equations and graphs. Lead your class to discussions on the properties of a function or a constant slope...
Curated OER
Texting and Grades II
Given the least squares regression line, interpret the slope and intercept in the context of the relationship between texting and GPA. Although this task is short and looks simple, some subtle points can be brought to light in a...
Balanced Assessment
On Averages and Curves
Determine the average on a curve. The class finds graphical representations of averages and expresses them both symbolically and on the graph. The assessment requires class members to justify using average to describe graphs.
Charleston School District
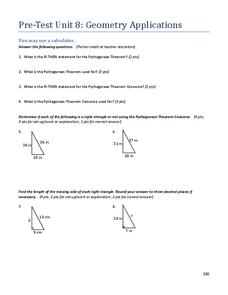
Pre-Test Unit 8: Geometry Applications
What does a squared and b squared make? C squared of course! The pre-test assesses eighth graders' knowledge of the Pythagorean Theorem, application of the Pythagorean Theorem, and finding volumes of solids.
Balanced Assessment
Catenary
Develop a model for a hanging chain. Pupils find a mathematical model for a hanging chain and then they compare their models to the precise function that models the curve. Scholars come up with a strategy to determine how close...


