Curated OER
Reading Graphs
Pupils practice plotting functions on the Cartesian coordinate plane, see several categories of functions, including lines and parabolas, and read a graph, answering questions about the situation described by the graph
Curated OER
Reading Graphs
Learners plot functions on the Cartesian coordinate plane. They explore lines and parabolas. Students analyze graphs and answer questions about the information presented on the graph using an online program.
Curated OER
Introduction to Linear Functions
Young scholars are introduced to the concept of linear functions. Using new terminology, they describe linear functions in sentences and in data tables. Using the internet, they calculate and record answers to problems which are...
Curated OER
Two Variable Inequalities
In this algebra worksheet, students solve inequalities using addition, subtractions and multiplication. They graph the inequalities with shading. There are 2 questions.
Curated OER
Circle Relationships
Students explore circles. In this geometry activity, students explore the relationship between the circumference of a circle, the distance a ball travels, and the number of rotations the ball must make in order to travel a certain...
Curated OER
High School Mathematics Problems from Alaska: Reading a Graph: Azimuth Range vs. Day in Barrow, Alaska
Students focus on reading and interpreting information from a graph.
Curated OER
Water: On the Surface and in the Ground
Students explore the differences between surface water and ground water. They collect data using maps and graphs and investigate a Texas river basin and a nearby aquifer. They complete a written report including maps and data regarding...
Curated OER
Water-Is There Going to be Enough?
Young scholars research the availability, usage and demand for water in the local area historically and use projections of the availability, usage and demand for water up to the year 2050. They gather data and present the information in...
Curated OER
Commercial Salmon Fishing
Students work with data about commercial fishing ofsalmon in Alaska. Students gather data, graph it, and analyze it.
Khan Academy
Khan Academy: Slope Intercept Equation From Graph
Practice finding the slope-intercept equation of a line from its graph. Students receive immediate feedback and have the opportunity to try questions repeatedly, watch a video or receive hints.
Khan Academy
Khan Academy: Slope Intercept Equation From a Graph
In this exercise, students practice determining a slope-intercept equation from a graph. Students receive immediate feedback and have the opportunity to watch a video, get hints, or try questions repeatedly.
Khan Academy
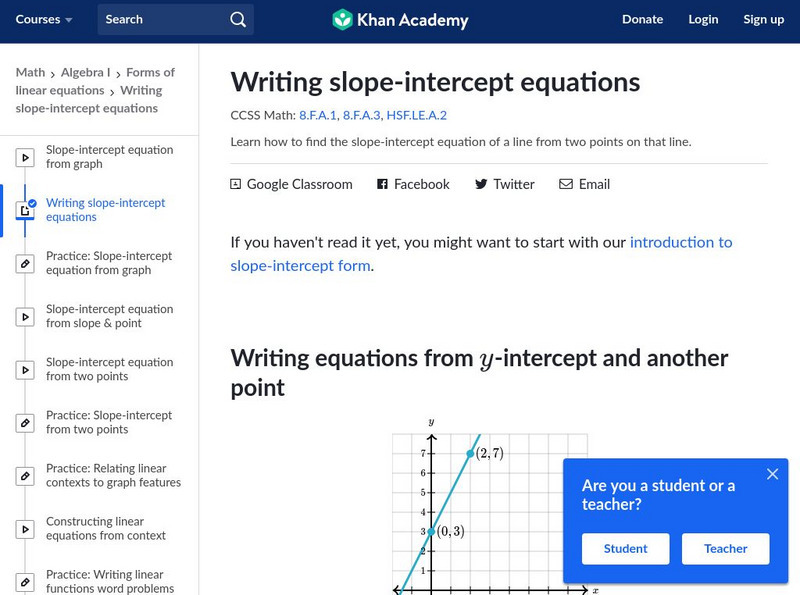
Khan Academy: Writing Slope Intercept Equations
Describes how to write a linear equation by using the y-intercept and another point on the line. Includes practice problems.
Khan Academy
Khan Academy: Slope Intercept Equation From Two Points
In this exercise, students practice constructing the linear equation given two points on a line graph. Students receive immediate feedback and have the opportunity to watch a video, get hints, or try questions repeatedly.
Khan Academy
Khan Academy: Graph From Slope Intercept Form
Practice drawing the graph of a line given in slope-intercept form. For example, graph y = 3x + 2. Students receive immediate feedback and have the opportunity to try questions repeatedly, watch a video or receive hints.
CK-12 Foundation
Ck 12: Algebra: Slope Intercept Form of Linear Equations
[Free Registration/Login may be required to access all resource tools.] This lesson covers find the equation of a line in slope-intercept form.
University of Colorado
University of Colorado: Ph Et Interactive Simulations: Graphing Slope Intercept
An interactive simulation that teaches about slope-intercept form and graphing linear equations through observations while connecting the slope and y-intercept to the line equations. This simulation can either be downloaded or played...
Khan Academy
Khan Academy: Slope Intercept Intro
Practice your basic understanding of slope-intercept form for linear equations. Students receive immediate feedback and have the opportunity to try questions repeatedly, watch a video or receive hints.
Math Planet
Math Planet: Algebra 1: Writing Linear Equations Using the Slope Intercept Form
Explains what the slope-intercept form is and how to find the equation of a line given two points on it. Includes modeled video lesson. [3:32]
Math Planet
Math Planet: The Slope Intercept Form of a Linear Equation
Provides examples and a video lesson that illustrates how to express linear equations using the slope-intercept form.
CK-12 Foundation
Ck 12: Algebra: Graphs Using Slope Intercept Form
[Free Registration/Login may be required to access all resource tools.] Identify the slope and y-intercept of lines and graph linear equations that are in slope-intercept form.
CK-12 Foundation
Ck 12: Algebra: Graphs Using Slope Intercept Form
[Free Registration/Login may be required to access all resource tools.] Learn how to graph lines using slope-intercept form.
Quia
Ixl Learning: Slope Intercept Form
Brush up on your math skills relating to slope-intercept form then try some practice problems to test your understanding.
Oswego City School District
Regents Exam Prep Center: Slopes and Equations of Lines
Explanation of linear equations and four types of slopes: positive, negative, zero, and undefined. Practice problems for the students are provided and a reinforcement activity using a graphing calculator is offered for the teacher's use.


