Curated OER
Graphing Linear Equations Using Data Tables
Learners review the Cartesian plane and the process of plotting points. In groups, students create tables, identify the slope and y-intercept, and graph the equation. Afterward, learners perform the same process, only, individually. As a...
Curated OER
Investigating Linear Equations Using Graphing Calculator
Students investigate linear equations using the Ti-Calculator. In this algebra lesson, students graph lines and identify the different quadrants on a coordinate plane. They identify ordered pairs used to plot lines.
Curated OER
Linear Functions Quiz
In this algebra worksheet, students solve 2 multi-step problems, where they use linear functions to determine the equation of a line.
Math Worksheet Center
Linear Quadratic Systems
In this linear quadratic system worksheet, students explore a system with a linear and a quadratic equation. With the given equations, students graph the parabola. They identify the axis of symmetry, the slope, points of intersection,...
Curated OER
Mobile vs. Money
Learners research the internet and use the information they find to plot straight line graphs. They use graphs to make comparisons of the various packages offered. Students interpret graphs and solve problems based on varying parameters.
Curated OER
Graphing and the Coordinate Plane
Students learn about the Cartesian coordinate plane, understand the four quadrants of the Cartesian coordinate plane, and plot points on the plane. Students read coordinates for a point from a graph and give the ratio of rise over run...
Curated OER
Graphing Inequalities and Shading
Students graph and shade inequalities. In this algebra instructional activity, students graph inequalities using the slope-intercept form. They shade the side of the line that is the solution and identify the domain and range.
Curated OER
Linear Functions, Restricted Domains, Infinite Geometric Series, Interconnections
In this math worksheet, students graph the linear functions in comparison to the inequalities. Then they compare the line segments on the coordinate plane.
Curated OER
Linear and Nonlinear Functions
Students identify properties of a line. In this algebra instructional activity, students differentiate between functions and nonfunctions. They use the slope and y intercept to graph their lines.
Curated OER
Reading Graphs
Students practice plotting functions on the Cartesian coordinate plane, see several categories of functions, including lines and parabolas, and read a graph, answering questions about the situation described by the graph
Curated OER
Reading Graphs
Students plot functions on the Cartesian coordinate plane. They explore lines and parabolas. Students analyze graphs and answer questions about the information presented on the graph using an online program.
Curated OER
Race Track (Culminating Activity)
Students graph and solve linear equations. In this algebra lesson, students use the slope and y-intercept to graph lines. They relate lines to the real world using different applications.
Curated OER
Real-World Linear Equations
Eighth graders practice technology skills through the use of a spreadsheet and a discovery lesson focusing upon linear equations. The technology allows for the visual changes to be displayed for different lines of equations.
Curated OER
Practice Exit Exam - Mat 0024
For this practice exit exam, students complete a variety of basic algebra problems on an Algebra I skill level. They simplify expressions containing variables, factor quadratic equations, find the slope of a line, identify the...
Curated OER
Graphing Scatterplots
Students examine scatterplots and determine the equation of a line using the slope-intercept method. Students interpret graphs, draw inferences, and sketch a curve of best fit for the graph. Based upon patterns in the graphs, students...
Curated OER
Linear Progression
Young scholars use graphing calculators to graph lines and create tables of values. They perform an experiment using M&M's and slinkys, then create their tables based on their results.
Curated OER
Graphing Review
Young scholars review the principles of graphing linear functions. They discuss plotting points on a coordinate plane, solving using a table, and then graphing. Students solve problems and determine the slope of the line, y-intercept...
Curated OER
Exploring Linear Equations
Eighth graders follow the teacher as they enter information into the graphing calculator. They investigate different graphs to explain the slope of a line, the y intercept, and parallel lines.
Curated OER
Mathematical Techniques - Basic Graphing
Students are introduced to significant figures and how to add, subtract, multiply and divide them. In a group, they practice plotting data points from a table to a graph and labeling all axes. They calculate the slope and y-intercept and...
Curated OER
Applying Properties to Variables
Eighth graders combine like terms in this properties of variables lesson. Using named items (stars, moons and hearts), they combine like terms using variables. They use the distributive property to combine like terms. Finally, they write...
Virginia Department of Education
Factors, Zeros, and Solutions
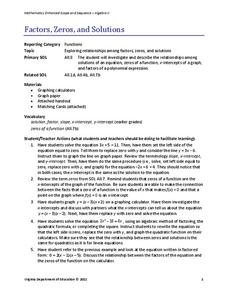
Factors, zeros, and solutions, oh my! Don't let your classes become overwhelmed with the vocabulary. An engaging instructional activity helps learners make a connection between factors, zeros, and solutions. Pupils explore the...
Charleston School District
Review Unit 4: Linear Functions
It's time to show what they know! An assessment review concludes a five-part series about linear functions. It covers all concepts featured throughout the unit, including linear equations, graphs, tables, and problem solving.
EngageNY
Nonlinear Models in a Data Context
How well does your garden grow? Model the growth of dahlias with nonlinear functions. In the lesson, scholars build on their understanding of mathematical models with nonlinear models. They look at dahlias growing in compost and...
Mathematics Vision Project
Module 8: Modeling Data
Statistics come front and center in this unit all about analyzing discrete data. Real-world situations yield data sets that the class then uses to tease out connections and conclusions. Beginning with the basic histogram and...


