Hi, what do you want to do?
Curated OER
Geometric Coordinates
In this geometric coordinates worksheet, students solve and complete 3 different types of problems. First, they use the equations provided to complete the table on the right. Then, students plot the x- and y- coordinates on the graph to...
Curated OER
Confusing Colors!
Fourth graders collect data, graph their data, and then make predictions based upon their findings. They's interest is maintained by the interesting way the data is collected. The data collection experiment is from the psychology work of...
Curated OER
Ohm's Law
Students explain the meaning of Ohm's Law, and plot a graph of voltage versus current, by explaining how the slope is the resistance of the circuit.
Curated OER
The Way to Better Grades!
Pupils collect and analyze data. In this statistics lesson, learners create a scatter plot from their collected data. They use, tables and graphs to analyze the data and mae decisions.
Curated OER
Cartesian Geometry
In this geometry worksheet, students plot coordinate pairs and connect the points to create different shapes. They give th shapes its polygon's name. They differentiate between simple functions and rectangular hyperbola.
Curated OER
Reading Graphs
Students plot functions on the Cartesian coordinate plane. They explore lines and parabolas. Students analyze graphs and answer questions about the information presented on the graph using an online program.
Curated OER
Graphing Data from the Chemistry Laboratory
Students graph and analyze data using a spreadsheet.
Curated OER
Obstacles to Success: Misleading Data
Eleventh graders explore how data reported by country agencies can mislead the public intentionally or unintentionally. In this Cross Curricular activity, 11th graders analyze charts and graphs in order to draw conclusions. Students...
Curated OER
Two Variable Inequalities
In this algebra activity, students solve inequalities using addition, subtractions and multiplication. They graph the inequalities with shading. There are 2 questions.
Curated OER
Inequalities are Everywhere
In this Algebra I worksheet, 9th graders work with a family member to graph inequalities on a number line. The two page worksheet contains five questions. Answers are included.
Curated OER
Geometry Coordinates
In this geometry worksheet, 10th graders calculate ordered pairs using a table to plot the coordinate pairs to make a graph. There are 3 graphing question.
Curated OER
Water: On the Surface and in the Ground
Young scholars explore the differences between surface water and ground water. They collect data using maps and graphs and investigate a Texas river basin and a nearby aquifer. They complete a written report including maps and data...
Curated OER
High School Mathematics Problems from Alaska: Reading a Graph: Azimuth Range vs. Day in Barrow, Alaska
Students focus on reading and interpreting information from a graph.
Northeast Parallel Architectures Center, Syracuse University
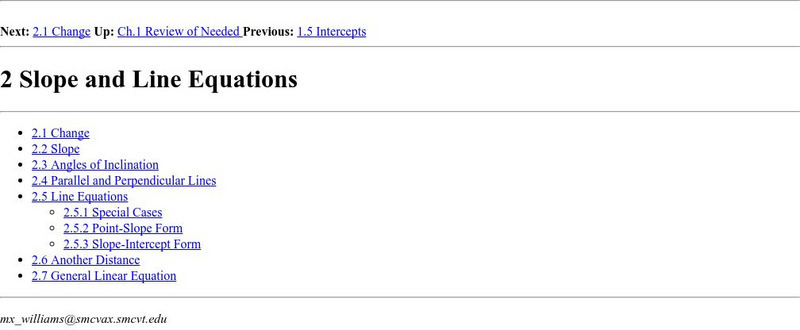
Npac Reu Program: Slope & Line Equations
This site from the Northeast Parallel Architectures Center, Syracuse University has a very substantial discussion of math topics slope & line equations. The outline form is quite useful if you need to zero in on one aspect of...
Vision Learning
Visionlearning: Linear Equations in Science: Relationships With Two Variables
An introduction to the history of linear equations and how they relate to science.
CK-12 Foundation
Ck 12: Algebra: Forms of Linear Equations
[Free Registration/Login may be required to access all resource tools.] Write linear equations in standard form and find the slope and y-intercept of such lines.
Khan Academy
Khan: Lesson 5: Relationships Among Linear Equations, Lines in Coordinate Plane
This lesson focuses on the relationship between algebraic, graphical, and contextual expressions of linear equations.
CK-12 Foundation
Ck 12: Algebra: Slope Intercept Form of Linear Equations
[Free Registration/Login may be required to access all resource tools.] This lesson covers find the equation of a line in slope-intercept form.
CK-12 Foundation
Ck 12: Algebra: Linear Equations in Point Slope Form
[Free Registration/Login may be required to access all resource tools.] Learn how to use the point-slope form of linear equations and functions.
TeachEngineering
Teach Engineering: Linear Equations Game
Students groups act as aerospace engineering teams competing to create linear equations to guide space shuttles safely through obstacles generated by a modeling game in level-based rounds. Each round provides a different configuration of...
University of Colorado
University of Colorado: Ph Et Interactive Simulations: Graphing Lines
Explore the world of lines. Investigate the relationships between linear equations, slope, and graphs of lines.
Texas Instruments
Texas Instruments: Using Activity Center: Slope/y Intercepts of Linear Equation
The teacher will submit an equation using activity center but will not show the students the equation.
CK-12 Foundation
Ck 12: Algebra: Linear Equations in Point Slope Form
[Free Registration/Login may be required to access all resource tools.] Learn how to use the point-slope form of linear equations and functions.


