Texas Instruments
Texas Instruments: Walk My Walk
A two-part activity that uses a CBR to develop the notion of slope and y-intercept through various walking activities. Part A develops a general notion of how changes in walking are reflected in various graphical representations. Part B...
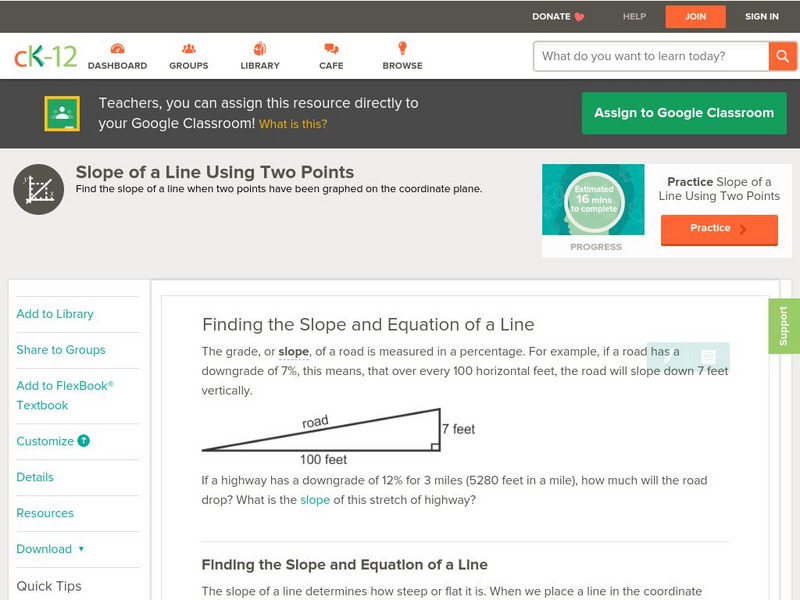
CK-12 Foundation
Ck 12: Algebra: Solutions to Compound Inequalities
[Free Registration/Login may be required to access all resource tools.] Solve compound inequalities and graph the solution set on a number line.
Illustrative Mathematics
Illustrative Mathematics: 8.ee Proportional Relationships, Lines, and Equations
In this task, 8th graders are shown the graphs of two lines with the same slope. They are given the equation for the first line and the coordinates of a point on the second and are asked to find the equation for the second line. Aligns...
Texas Education Agency
Texas Gateway: Modeling Data With Linear Functions
Given a scatterplot where a linear function is the best fit, the student will interpret the slope and intercepts, determine an equation using two data points, identify the conditions under which the function is valid, and use the linear...
Interactive Mathematics
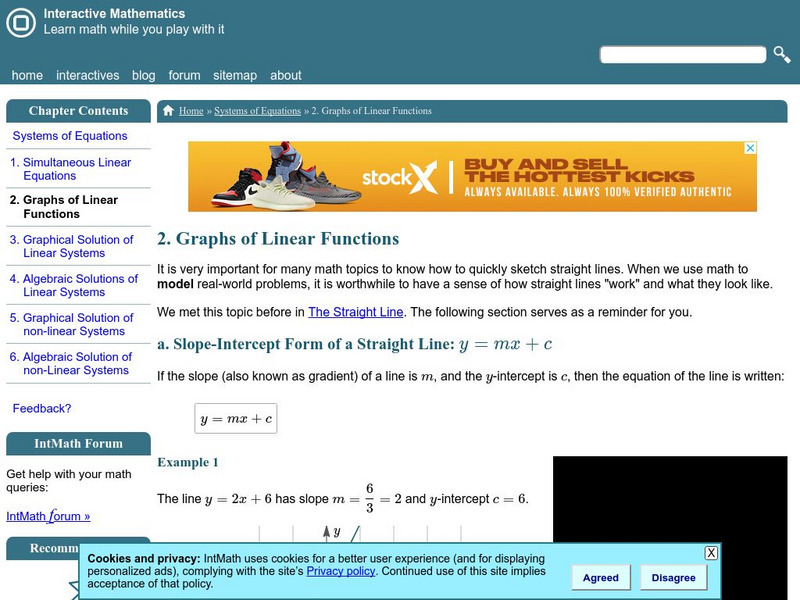
Interactive Mathematics: Graphs of Linear Functions
A brief overview of three methods used to graph lines is presented through examples. Slope-intercept, point-slope, and intercept form are demonstrated step-by-step along with a review of the formula for finding the slope of a line.


