College Board
Frozen in Time
Take a closer look at increasing and decreasing behavior by zooming in on graphs. An AP® Calculus reference document examines how increasing/decreasing behavior should be considered in terms of intervals rather than points. The resource...
Curated OER
Visual Literacy: Using Images to Increase Comprehension
A colorful PowerPoint is a great way to introduce the topic of visual literacy. The eye-catching presentation begins with an overview of visual literacy and then provides some specific strategies to help enhance reading comprehension. As...
College Board
Power in Tests of Significance
Test your knowledge of tests of significance. A curriculum model for AP® Statistics describes and defines power in terms of tests of significance. It also provides two classroom activities designed to investigate power and how it relates...
College Board
Is That an Assumption or a Condition?
Don't assume your pupils understand assumptions. A teacher resource provides valuable information on inferences, assumptions, and conditions, and how scholars tend to overlook these aspects. It focuses on regression analysis, statistical...
College Board
AP Calculus: Slope Fields
Ready to field questions about slope fields? An article on AP® Calculus teaching methods describes how to teach about slope fields to solve differential equations. It gives some sample problems to consider with the class and how to...
EngageNY
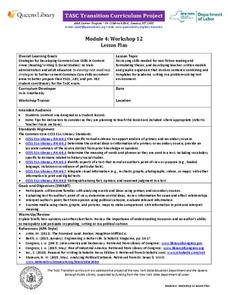
TASC Transition Curriculum: Workshop 12
How can opinions slant facts? Workshop participants learn how to examine primary and secondary sources and identify the author's point of view. They also examine how visual art impacts the meaning and rhetoric of sources. Full of...
College Board
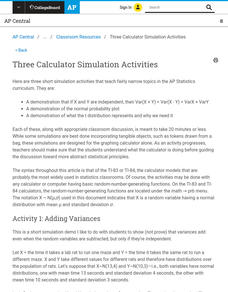
Three Calculator Simulation Activities
Calculators sure come in handy. An AP® Statistics instructional resource provides suggestions for using calculator simulations. It gives activities for adding variances, normal probability plots, and t distributions.
College Board
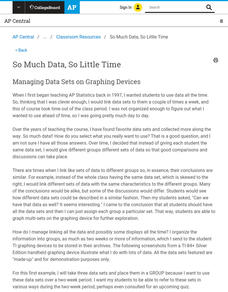
So Much Data, So Little Time
Organizing data in a statistics class is often a challenge. A veteran statistics teacher shares data organization tips in a lesson resource. The instructor shows how to group data to link to individual calculators in a more efficient...
College Board
Extrema
No need to go to extreme lengths to find resources on extrema. The central focus of an AP® curriculum module is on critical points and extrema, and how to cover these concepts throughout the course. A set of three worksheets helps assess...
Other
Kindergarten lessons.com: Graphing Activities
Graphing activities for preschool and kindergarten include collecting data and organizing it in a variety of ways. There are lots of fun things to do in this area of math and the activities integrate well with science and literacy...
Buck Institute
Buck Institution for Education: Pblu: What Will They Think?
Graphing and making predictions go hand in hand during this real-world example of project-based learning.
George Mason University
Handmade Manipulative Instructions
At this personal site, you will find pages of math manipulatives and different types of graphing paper to print out and use in your classroom.
PBS
Pbs Learning Media: Think Math
Think Math offers a collection of 43 KET-produced resources from Math at the Core: Middle School, including 17 Scale City videos and interactives about proportional reasoning, 14 Wild Fractions animations and games that feature visual...
Other
National Council of Supervisors of Mathematics: Slope and Linear Functions
National Council of Supervisors of Mathematics: similarity, slope, and graphs of linear functions provides a teacher learning module, on how to effectively teach similarity, slope, and graphs to develop skill in reasoning about reasoning...
University of Regina (Canada)
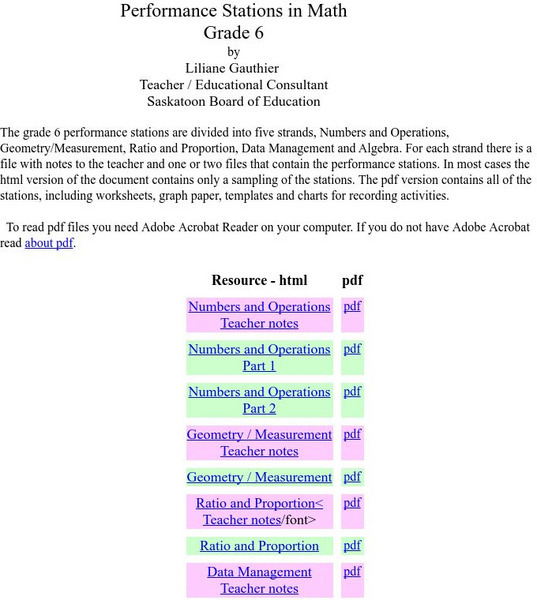
University of Regina: Math Central: Performance Stations in Math: Grade 6
The Saskatoon Board of Education provides teachers with this collection of grade six math performance stations. Although several of the stations have been designed as assessment tools for the Saskatchewan curriculum, teachers may also...
University of Regina (Canada)
University of Regina: Math Central: Performance Stations in Math: Grade 7
The Saskatoon Board of Education provides teachers with this collection of grade seven math performance stations. Although several of the stations have been designed as assessment tools for the Saskatchewan curriculum, teachers may also...
University of Regina (Canada)
University of Regina: Math Central: Performance Stations in Math: Grade 8
The Saskatoon Board of Education provides teachers with this collection of grade eight math performance stations. Although several of the stations have been designed as assessment tools for the Saskatchewan curriculum, teachers may also...
University of Regina (Canada)
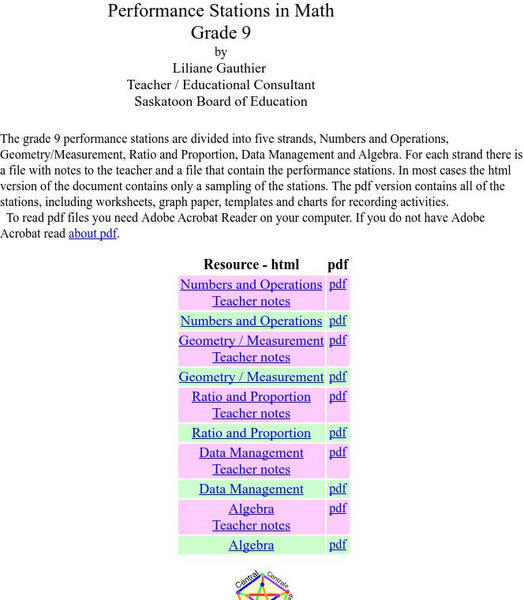
University of Regina: Math Central: Performance Stations in Math: Grade 9
The Saskatoon Board of Education provides teachers with this collection of grade nine math performance stations. Although several of the stations have been designed as assessment tools for the Saskatchewan curriculum, teachers may also...
University of Utah
University of Utah: Genetic Science Learning Center: teach.genetics: Introduction to Heredity
A three-day unit introduces heredity by helping students identify their own genetic traits and then leading them in an exploration of generational traits and variation. Find printable worksheets, data tables, and graphs, as well as...
Annenberg Foundation
Annenberg Learner: Robots
The owner of a factory has two expensive robots to automate a manufacturing process. Use the topological concept of a configuration space to coordinate their actions and maximize their efficiency on the manufacturing floor.
PBS
Pbs Learning Media: Peg + Cat Collection
The Peg + Cat on-air series and online resources provide many opportunities for educators to introduce or reinforce early math concepts. In each 11-minute on-air episode of this animated, math-based series for 3-8 year olds, Peg and Cat...
Louisiana Department of Education
Louisiana Doe: Louisiana Believes: Eureka Math Parent Guide: Collecting and Displaying Data
A guide to support parents as they work with their students in collecting and displaying data.
Louisiana Department of Education
Louisiana Doe: Louisiana Believes: Eureka Math Parent Guide: Problem Solving With Length, Money, and Data
A guide to support parents as they work with their students with problem solving with length, money, and data.
Louisiana Department of Education
Louisiana Doe: Louisiana Believes: Eureka Math Parent Guide: Ordering and Comparing Length Measurements as Numbers
A guide to support parents as they work with their students in ordering and comparing length measurements as numbers.
Other popular searches
- Coordinate Graphing Pictures
- Graphing Ordered Pairs
- Graphing Skills Lesson Plans
- Coordinate Graphing
- Graphing Linear Equations
- Holiday Coordinate Graphing
- Graphing Linear Inequalities
- Graphing Calculator
- Graphing Inequalities
- Halloween Math Graphing
- Graphing Mean, Median, Mode
- Graphing Data


