Curated OER
Putting It All Together: The Personal Plan of Study (Part 3)
Eighth graders discuss the culminating activity to a unit in which they determine how they will present their "Design for My Future" and "My Personal Plan of Study." They pull together all of their work from the unit before writing a...
Curated OER
Virtual Field Trip
Are we there yet? Young trip planners learn about their state and plan a trip. They will select sites to see in three cities in their state, and record associated costs in a spreadsheet. While this was originally designed as a...
Curated OER
Finding Your Pulse Rate
Fifth graders demonstrate how to find their pulse and count the beats after a certain amount of time. In cooperative pairs, 5th graders use a stopwatch to keep track of their partner's heart rate in seconds. Pairs make a graph from their...
Curated OER
Fast Food Survey Using Bar Graphs
Second graders create a bar graph to pictorically represent the data collected from a survey of students. They use Excel to electronically create the graphs and data tallies. They then interpret their data using sentences to explain.
Curated OER
Metric Olympics
Learners participate in a Metric Olympics event and use metric measurements to measure actual performances in their events. They throw a plastic straw for a javelin event, participate in a long jump and high jump event, and a variety of...
Curated OER
Give and Take
Second graders are introduced to the differences between goods and services. In groups, they discover whether a given occupation offers a good, service or both. To end the lesson, they pick one occupation that interest them, draws a...
Curated OER
Planets an Introduction
Fourth graders investigate one planet, enter information into a database, and print the database sorting for each of the attributes.
Curated OER
Addition and Subtraction in Center Time
First graders use bean bags, dominos, number trains, counters, paper clips, flashcards, beads and more in a variety of centers to practice basic addition and subtraction facts.
Curated OER
Tallies Tell It All
Students count a number of objects and create a tally with groupings of five to illustrate their total. They identify a number of things both at school and at home that can be counted with tallies and create appropriate tallies for each.
Curated OER
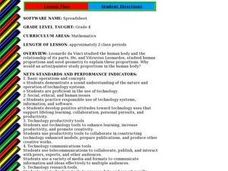
Body Proportion
Fourth graders measure the height and arm span of various classmates. They use a spreadsheet to design a graph that shows the class measurements from tallest to shortest in metric and standard systems.
Curated OER
Addition and Subtraction in Center Time
First graders complete center activities as they practice their addition and subtraction skills. They listen to Rick Walton's, "How Many, How Many, How Many" before playing games, and completing addition and subtraction worksheets at...
Curated OER
Tallies Tell It All
Students explore data collection through the use of tally marks. After a demonstration of the use of tally marks students complete various inquires where they create a chart documenting the number of times a desired result happens. They...
Curated OER
Graphic Favorite Breakfast Foods
Second graders graph data based on a class survey of their favorite breakfast foods. For this graphing lesson plan, 2nd graders take a class survey of their favorite breakfast foods. Then they take that data and put it into a computer...
Curated OER
Fast Food Survey Using Bar Graphs
Second graders conduct survey and sort data according to categories, construct bar graph with intervals of 1, and write a few sentences about their graphs.
Curated OER
Timed Multiplication Test Graphs
Students use the tools of data analysis for managing information. They solve problems by generating, collecting, organizing, displaying histograms on bar graphs, circle graphs, line graphs, pictographs and charts. Students determine...
Curated OER
Virtual Field Trip / Activity Research
Learners visit a website to determine activities at three Michigan cities. They calculate the total cost of participating in the activities or visiting places such as zoos, planetariums, historic sites, and museums.
Curated OER
Body Part Measurements
Second graders participate in a review of how to use rulers and yard sticks while collecting measurement information. They measure assigned body parts and chart the data on collection sheets. They make a spreadsheet with the information...


