Inside Mathematics
Quadratic (2009)
Functions require an input in order to get an output, which explains why the answer always has at least two parts. After only three multi-part questions, the teacher can analyze pupils' strengths and weaknesses when it comes to quadratic...
Pennsylvania Department of Education
Volume of Regular and Irregular Objects
Fifth graders examine patterns and relate to equations to solve math problems. In this patterns lesson, 5th graders diagram, graph, use models and use tables to solve equations for real world problems.
Curated OER
Between The Extremes
Students analyze graphs for specific properties. In this algebra lesson plan, students solve equations and graph using the TI calculator. They find the different changes that occur in each graph,including maximum and minimum.
Noyce Foundation
Pizza Crusts
Enough stuffed crust to go around. Pupils calculate the area and perimeter of a variety of pizza shapes, including rectangular and circular. Individuals design rectangular pizzas with a given area to maximize the amount of crust and do...
Noyce Foundation
Ducklings
The class gets their mean and median all in a row with an assessment task that uses a population of ducklings to work with data displays and measures of central tendency. Pupils create a frequency chart and calculate the mean and median....
Noyce Foundation
Sewing
Sew up your unit on operations with decimals using this assessment task. Young mathematicians use given rules to determine the amount of fabric they need to sew a pair of pants. They must also fill in a partially complete bill for...
Curated OER
Math: Navigating the World Around Me
Young mathematicians research and discuss real world math word problems and ways in which they apply math concepts in their everyday lives. They create a storyboard of a math word problem from which they create a slide for a multi-media...
Curated OER
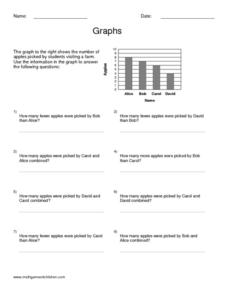
Graphs
In this algebra worksheet, students calculate the point of intersection between a circle and a straight line. There are 5 questions with an answer key.
Curated OER
Two-Variable Linear Inequalities
Here is an engaging lesson plan on solving equations with two variables. Have the class rewrite linear equations in the slope intercept form, y=mx + b. They graph the lines using the slope and y-intercepts.
Curated OER
Traveling Cart Activity
Students explore the relationship between distance and elapsed time. After writing a quadratic equation to exemplify the relationship discussed, students use inverse matrices to solve the unknowns. Using a motion detector and CBL...
Curated OER
Solutions, Solutions, Could it Be?
Students graph and solve linear system of equations. In this algebra activity, students use algebraic and graphing methods to solve their systems. They find the point of intersection for their solution and draw inference from their data.
Curated OER
Matricies: Meadows or Malls?
Students explore the use of matrices and graphing calculators to solve a complex linear programming problem. They test their solutions to determine the best division of land use for the city.
Curated OER
Augmented Matrices
Pupils write systems of equations in an augmented matrix and enter it into their calculator. They use the reduced row echelon function on the calculator to solve the system of equations.
EngageNY
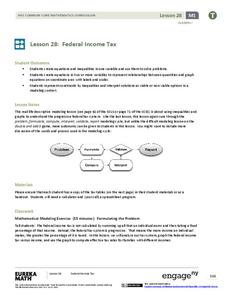
Federal Income Tax
Introduce your class to the federal tax system through an algebraic lens. This resource asks pupils to examine the variable structure of the tax system based on income. Young accountants use equations, expressions, and inequalities to...
Virginia Department of Education
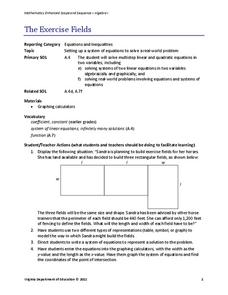
The Exercise Fields
Horses need exercise, too. Scholars create linear equations to model the perimeter of exercise fields for horses. They finish by solving their equations for the length and width of the fields.
Curated OER
Virtual Field Trip
Are we there yet? Young trip planners learn about their state and plan a trip. They will select sites to see in three cities in their state, and record associated costs in a spreadsheet. While this was originally designed as a...
Curated OER
The Kangaroo Conundrum: A Study of a Quadratic Function
Students play a game and collect data for their graph. In this algebra lesson plan, students solve quadratic equations and identify properties of their graph. They describe the pattern created by the graph and the game.
Curated OER
Wacky Water World
Eighth graders calculate a system of equations to find the best ticket price for a ticket at a water park. They explain how the equations helped them make their decision on the best price.
Curated OER
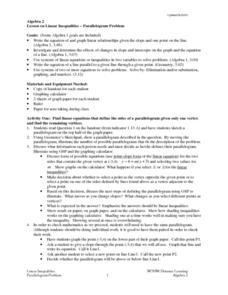
Linear Inequalities - Parallelogram Problem
Students use the Geometer's Sketchpad to illustrate possible answers to a parallelogram problem. As a class, they discuss the point-slope and linear equation forms. Individually, students solve their equations and check the results on...
Curated OER
That's a Fine Line You're Walking!
Students experiment with Hiker program to practice real world applications of linear functions and develop their understanding of expressions, relationships, and manipulations involved in writing and graphing linear equations in...
Curated OER
What's The Point?
Students solve word problems using the correct math symbols. For this algebra lesson, students use the TI calculator to graph their equation and analyze it. They find the line of regression and use to draw conclusion.
Curated OER
Means of Growth
Students collect and graph data. In this statistics lesson, students analyze their plotted data using a scatter plot. They identify lines as having positive, negative or no correlation.
Curated OER
Does Music Cam the Savage Beast?
Students collect, graph and analyze data. In this statistics lesson, students measure the heart beat of a person as they listen to music. They use the CBL and TI to create a graph, analyzing the outcome.
Curated OER
Maps and Modes, Finding a Mean Home on the Range
Fifth graders investigate data from maps to solve problems. In this data lesson, 5th graders study maps and collect data from each map. Students present their data in a variety of ways and calculate the mode, mean, median, and range.


