Curated OER
Grating Spectrometer
Students calculate the Balmer series. In this physics lesson, students observe hydrogen lamp spectra using spectrometers. They calculate wavelength and compare them with their theoretical calculations.
Curated OER
Introduction to Light
Young scholars study the basic structure of the atom. In this chemistry lesson plan, students explain how colors relate to energy that electrons emit. They calculate energy of the emitted photons.
Curated OER
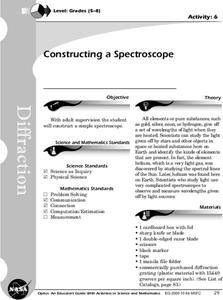
Constructing a Spectroscope
Students construct a simple spectroscope. They observe the emission spectrum produce by a source of light.
Curated OER
The Doctrine of Signatures
Students use the graphing calculator and the core equation: y=Ax^2+Bx+C where A = the acceleration of gravity/2, B = the initial velocity, and C = initial height above ground to graph parabolas for Earth and Mars. They experiment with...
Curated OER
Spectroscopy Demonstrations
Students study light and see what emits photons and that light can be separated onto a spectrum. In this energy and matter instructional activity students identify gases using a spectrum chart.
Curated OER
An Eclipsing Binary System with a Precessing Accretion Disk
Students work together to complete an experiment over binary sources. They determine values for the orbital period of certain objects and interpret intensity changes. They also calculate a value for the period of precession of an...
University of Colorado
University of Colorado: Physics 2000: Spectral Lines
Several pages from an excellent site which describe the science of spectroscopy. The unique atomic emission (and absorption) line spectrum of elements are illustrated and explained. Includes a Java applet depicting the quantum energy...
Wikimedia
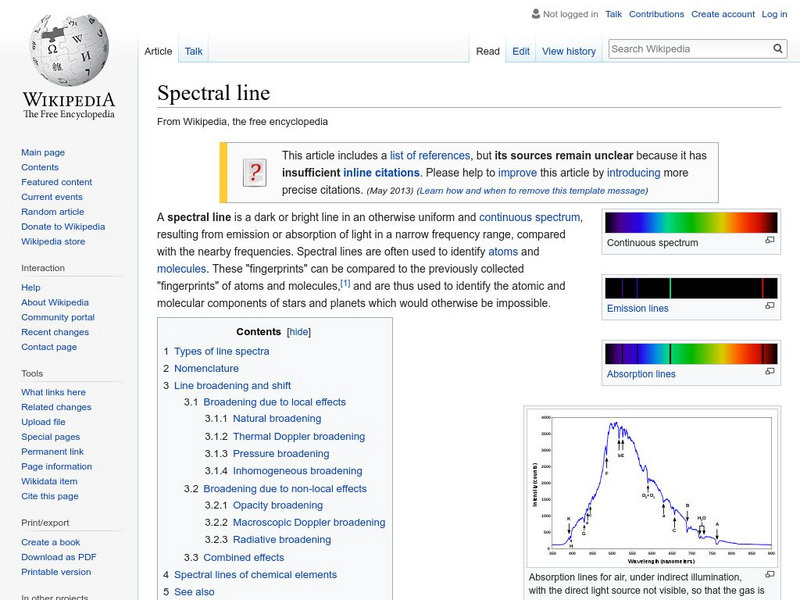
Wikipedia: Spectral Line
Wikipedia offers information on spectral line, a dark or bright line in an otherwise uniform and continuous spectrum.
University of Colorado
University of Colorado: Physics 2000: Balmer's Formula
A short description of a physics lab involving the determination of the wavelength of the four spectral lines in the hydrogen emission spectrum. Perhaps the most important part of the page is the picture of the spectrometer.
NASA
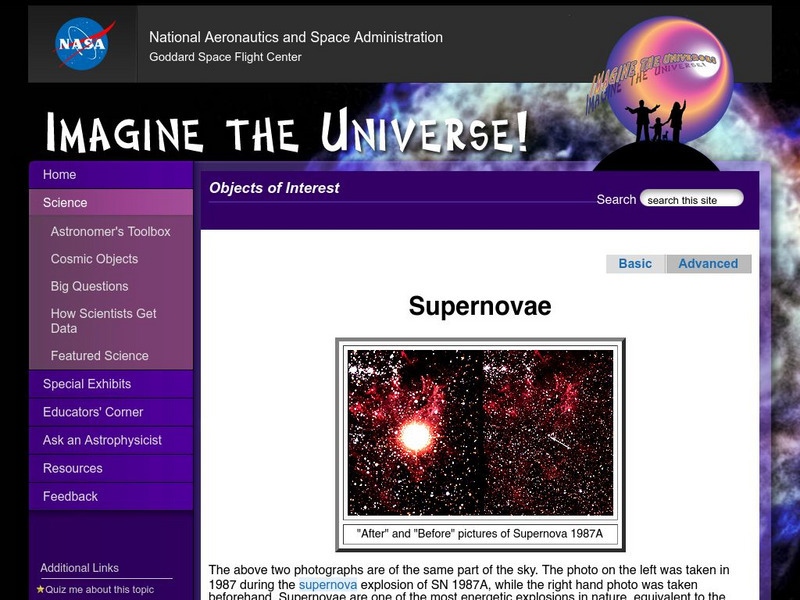
Nasa: Imagine the Universe: Supernovae (Advanced)
Supernovae are divided into two basic physical types, including a description of supernova types and how they are classified based on the existence of hydrogen spectral lines. Definitions of key terms are provided.
Florida State University
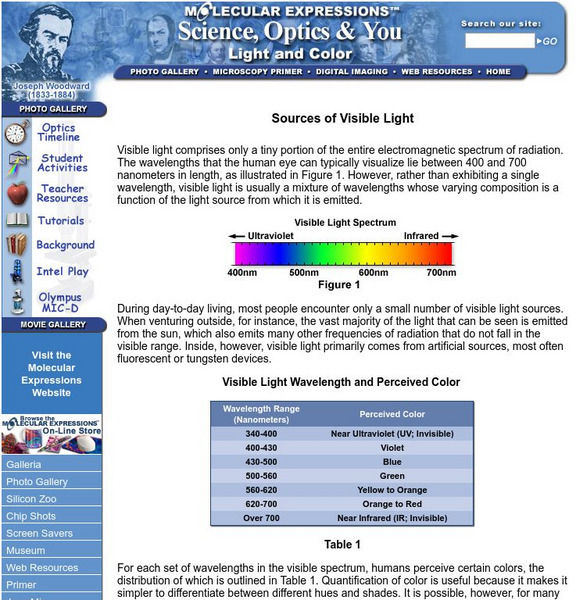
Florida State University: Light and Color: Sources of Visible Light
This site discusses primary lighting sources and gives information on the different properties and spectral characteristics of each. Also includes links to some interactive Java applets.
NASA
Nasa: The Sun
An introduction to the Sun including its size and distance from the Earth, sunspots, flares and coronal mass ejections.
Science Education Resource Center at Carleton College
Serc: Properties of Cations: Flame Test Lab
In this lab, learners will learn the relationship between color emitted by atoms of metal compounds and their electron structure by using the flame test.
NASA
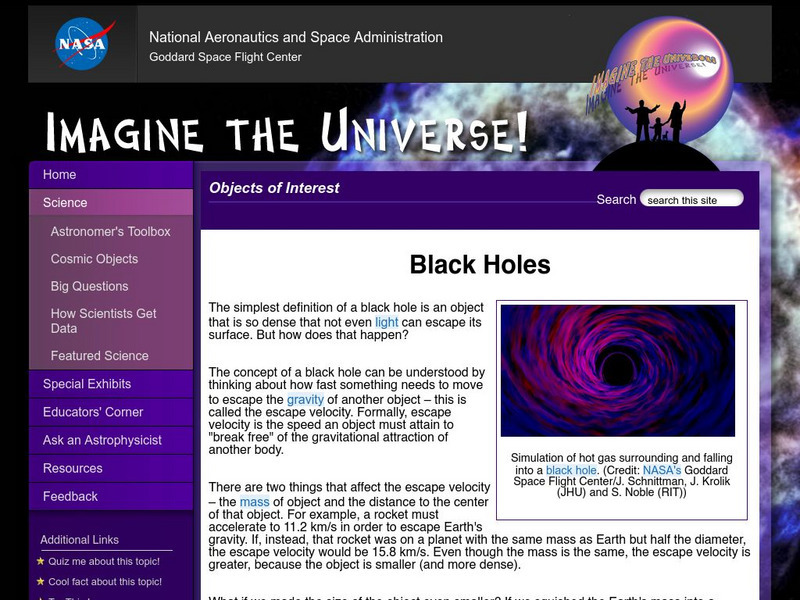
Nasa: Imagine the Universe: Black Holes
Learn what black holes are and the myths that surround them.
CK-12 Foundation
Ck 12: Chemistry Simulation: Neon Lights
[Free Registration/Login Required] Neon lights are a type of discharge tube. Observe how electrons create colored light in a hydrogen gas discharge tube. Can you figure out why hydrogen's emission spectrum contains more than one color of...
Other
Sky Server: Types of Stars
SkyServer of the Sloan Digital Sky Survey shows you the different types of stars as well as how to classify and identify them.
Other
Stat Soft: Statistics Glossary
Dozens of statistical terms are defined and illustrated in this glossary.

