Science Education Resource Center at Carleton College
Serc: Investigating Motion Graphing Speed
In this introduction to motion activity, students will get a personal understanding of speed and acceleration by experiencing it firsthand. Wheeled office chairs or other cart like devices are used to give one student a ride as a fellow...
Science Education Resource Center at Carleton College
Serc: Motion: Investigating Motion Graphs
In this lesson plan, students investigate motion graphs. Students predict what the distance-time graph and velocity time graph would look like for a student walking across the room for three different scenarios.
Physics Aviary
Physics Aviary: Motion Graph Matching
You will be given a velocity vs. time graph for the motion of a car. Your job is to match the graph with your car by pushing on the gas or brake or coasting at the appropriate moments. Before you start the matching game, you must set the...
TeachEngineering
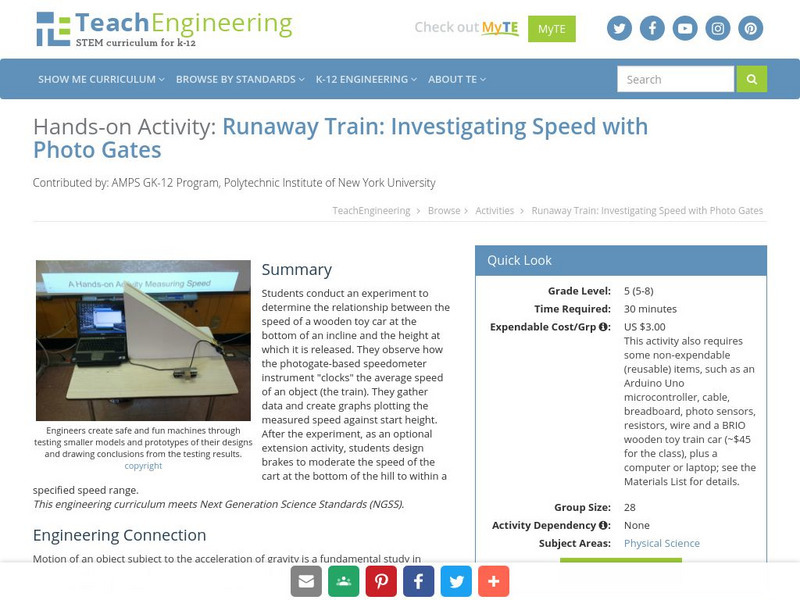
Teach Engineering: Runaway Train: Investigating Speed With Photo Gates
Students conduct an experiment to determine the relationship between the speed of a wooden toy car at the bottom of an incline and the height at which it is released. They observe how the photogate-based speedometer instrument "clocks"...
CK-12 Foundation
Ck 12: Episd: Position Time Graphs
[Free Registration/Login may be required to access all resource tools.] Understand how to evaluate data presented in graphs based on speed and velocity calculations.
Khan Academy
Khan Academy: Instantaneous Velocity and Speed From Graphs Review
Review the key terms and skills related to analyzing motion graphs, such as finding velocity from position vs. time graphs and displacement from velocity vs. time graphs.
Khan Academy
Khan Academy: Physics: Average Velocity and Average Speed From Graphs
Solve problems where you must find the average velocity or speed by analyzing graphs. Hints and helpful videos are available when needed.
Texas Education Agency
Texas Gateway: Changes in Motion
Given diagrams or scenarios, students will measure and graph changes in motion.
Texas Education Agency
Texas Gateway: Speed, Velocity, and Acceleration
Given descriptions, illustrations, graphs, charts, or equations, students will differentiate between speed, velocity, and acceleration.
CK-12 Foundation
Ck 12 Exploration Series: Simulations: Physics: Butterfly Stroke
[Free Registration/Login Required] Learn about the relationship between velocity and position for a swimmer. Adjust the velocity of the legs, streamline, and arms to experiment with the slope of velocity in the simulation swimmer. Dig a...
CK-12 Foundation
Ck 12: Physical Science: Position Time Graphs
[Free Registration/Login may be required to access all resource tools.] How motion and speed can be represented by a distance-time graph and how average speed can be calculated from it.
Texas Education Agency
Texas Gateway: Changes in Motion
In this lesson, you will learn about position vs. time graphs and velocity vs. time graphs and how to use them to solve problems.
Physics Aviary
Physics Aviary: Graphing Motion Lab 2
This lab was designed to generate some data that students can use when learning about two stage graphing motion. Students will track the motion of a dragster as it accelerates and then moves at a constant speed and then they will create...
Science Education Resource Center at Carleton College
Serc: Graph Predictions for Position, Velocity and Acceleration
Students interactively create predictions of position, velocity, and acceleration graphs using java applets. The applets automatically classify student answers, so instructors can create graphs of student predictions.
Science Education Resource Center at Carleton College
Serc: Investigating Motion: Calculating and Graphing Students Walking Speed
In this activity young scholars will collect and analyze data of their walking speed. They will compare their speed to an outside speed walker. They will determine their speed every 20 meters up to 100 meters. They will complete five...
Khan Academy
Khan Academy: Simple Harmonic Motion: Find Speed, Velocity, Displace From Graphs
Practice finding speed, velocity, and distance traveled for an oscillator from graphs of simple harmonic motion.
Texas Instruments
Texas Instruments: Graphing Motion: Instantaneous and Average Speed
Students are introduced to the calculator as a graphing tool and distinguish between average speed and instantaneous speed.
Texas Instruments
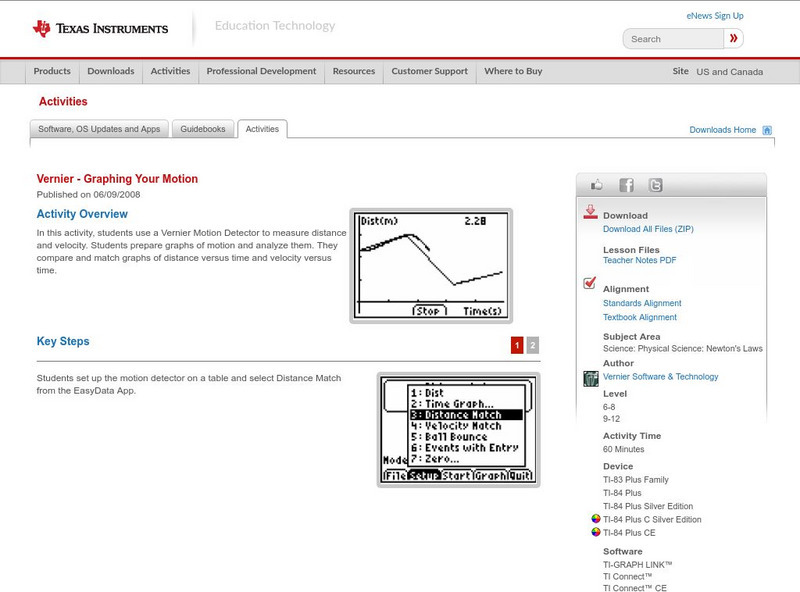
Texas Instruments: Graphing Your Motion
In this activity, students use a Motion Detector to measure distance and velocity. Students prepare graphs of motion and analyze them. They compare and match graphs of distance versus time and velocity versus time.
CK-12 Foundation
Ck 12 Exploration Series: Simulations: Physics: Model Rocket
[Free Registration/Login Required] Learn about the relationship between position and velocity for a model rocket during launch and in free-fall. Experiment with rocket mass, rocket thrust, and rocket burn time to understand the...
Science Education Resource Center at Carleton College
Serc: Hot Wheelin' With Speed, Acceleration, and Data Graphs
In this lab, students investigate the motion of toy cars and collect data to analyze the speed of the vehicle between various points and overall speed.
BBC
Bbc: Gcse Bitesize: Motion
This lesson focuses on motion including definitions, how to calculate the change in velocity and the average acceleration, and a link to an assessment.
Georgia State University
Georgia State University: Hyper Physics: Wave Motion
Two wave graphs depicting a sine wave and relating the various characteristics (wavelength, amplitude, frequency, and period) of a wave to each other. The site includes an interactive JavaScript form in which the visitor enters one...
Khan Academy
Khan Academy: Average Velocity and Speed With Direction Changes: Word Problems
Practice calculating average velocity and speed from word problems when an object changes directions.
Texas Instruments
Texas Instruments: Classroom Activities: Parachuting
This activity explores a parachutist and her position, velocity and acceleration. Graphing and calculating these functions will be required.

