Hi, what do you want to do?
EngageNY
Relationships Between Quantities and Reasoning with Equations and Their Graphs
Graphing all kinds of situations in one and two variables is the focus of this detailed unit of daily lessons, teaching notes, and assessments. Learners start with piece-wise functions and work their way through setting up and solving...
Curated OER
Cosmic Bar Graphs
In this cosmic bar graph worksheet, learners solve 2 problems using given bar graphs that plot the number of galaxies vs. the galaxy type and the number of gamma-ray bursts vs. the burst classification. Students find the fraction of...
Benjamin Franklin High School
Saxon Math: Algebra 2 (Section 3)
In this third of a twelve-part series, the focus moves from using matrices to solving systems of equations with substitution and elimination, including more than two dimensions and variables in equations, and analyzing statistical data....
Mathematics Vision Project
Module 6: Congruence, Construction, and Proof
Trace the links between a variety of math concepts in this far-reaching unit. Ideas that seem very different on the outset (like the distance formula and rigid transformations) come together in very natural and logical ways. This...
CCSS Math Activities
Smarter Balanced Sample Items: 7th Grade Math – Target D
Put expressions, equations, and inequalities to work! Young scholars solve problems using various strategies. Meant as a snapshot of the Smarter Balanced Assessment, a set of seven questions includes topics from writing expressions to...
Curated OER
Wind
Students make a wind vane, anemometer, wind spiral, and wind streamer to calculate wind movement. In this wind lesson plan, students test each of their wind instruments, and graph the results of the wind speed in different locations.
Curated OER
The Very Hungry Caterpillar
Read the story, The Very Hungry Caterpillar, and complete activities from multiple subjects. Make a mural, create a class graph, discuss the life cycle of a butterfly, research information about butterflies on the Internet and make...
Curated OER
Shattered Images Value Study
Students create cubist drawings using grids and enlargement.
Curated OER
1st Geometry
In this geometry worksheet, students choose the multiple choice answer to 15 questions involving several different elements of geometry.
Texas Instruments
Texas Instruments: Numb3 Rs: Spiraling Out
Based off of the hit television show NUMB3RS, this lesson gives students further insight into the various spirals that can be graphed using polar equations. While the lesson assumes that students already have some background with polar...
Other
Calculus Animations With Mathcad: Polar Curves
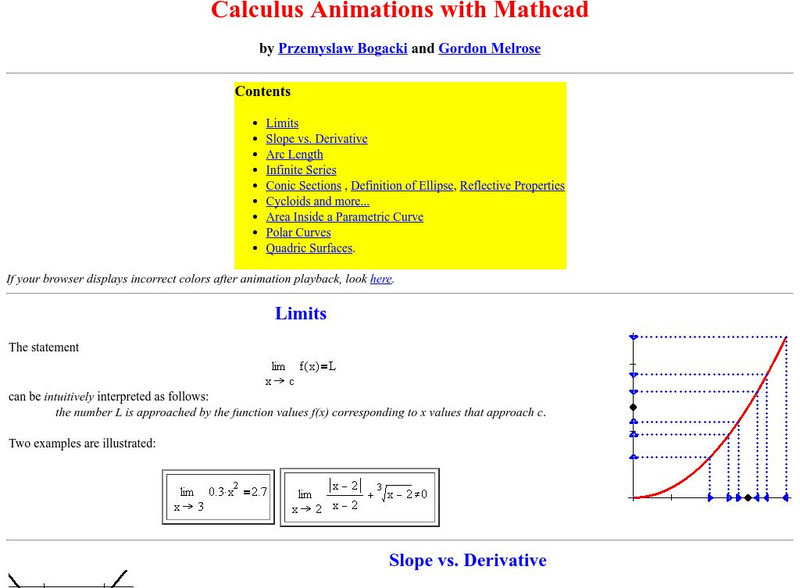
Contains an animation that will show you how the graphs of a number of polar equations are graphed. (Page may take some time to load completely.)


