Hi, what do you want to do?
Curated OER
Research a State in the United States
Students research one state of the United States of their choice. Using the internet, they gather as much information about the state as possible along with appropriate images. They present their findings to the class in the form of a...
Curated OER
Graphing Grazy Crayons
Children create crazy crayons they made to sort and construct a floor bar graph. Then, using technology resources, they make a simple bar graph to compare the top four colors produced. Students will then interpret the printed graph by...
Curated OER
Determination of the percentage of Acetic Acid in Vinegar
Students determine the concentration of acetic acid when the concentration of the base with which is titrated is known. They investigate how to weigh a sample using the balance, measure volumes using graduated cylinder, explore the...
Curated OER
Fraction Strips on Excel
Sixth graders create three different sets of fraction strips using Excel by following a packet of instructions that taper off as the students gain confidence in their knowledge of Excel. They copy and paste the strips into Word so that...
Curated OER
Bringing Young Architects to Surface
Students work in pairs to design a building. In this architecture instructional activity, students take on the role of head architect to design and construct a 3-D scale model a building for a client. Students' goal is...
Curated OER
Bubble Gum Chemistry
Students explore the concept of graphing data. In this graphing data instructional activity, students determine the percentage of sugar in bubble gum. Students graph type of gum vs. sugar percentage. Students create a table of their data.
Curated OER
ABC's of Banking
Students explore the concept of managing money. In this managing money lesson plan, students discuss how to write checks and keep an accurate check registry. Students discuss the importance and uses of debit cards and deposit forms.
Curated OER
Embracing Diversity
Ninth graders discover that the amount surveyed affects the results and conclusions drawn from a survey. In this sampling lesson students explore the concept that a valid conclusion require a large number of entries. Students...
Curated OER
Visit My Class Wikis
Students visit the links on the blog site to learn about class wikis. In this technology integration lesson, students visit the links to view class wikis.
Curated OER
SolidWorks for Sheet metal
Students practice using the different tools on the Sheet Metal toolbar. In this engineering lesson, students create a sketch given a set of procedures to follow.
Other
Nearpod: Spreadsheets: Using Formulas
In this lesson on spreadsheets, students explore the different parts of a spreadsheet and use equations within spreadsheets to learn about their applications.
Other
Technology for Learners: A Fun Way to Start Learning About Spreadsheets
A fun way to start learning about spreadsheets.
Science Education Resource Center at Carleton College
Serc: Salmon Use of Geomorphically Restored Streams at Point Reyes Nat. Seashore
A lesson plan with an accompanying PowerPoint learning module for students where they learn about coho salmon and a repair done to a culvert in Point Reyes National Seashore. The repair was intended to help the salmon make their journey...
Science Education Resource Center at Carleton College
Serc: Yellowstone! A National Park on a Hot Spot
A lesson plan with an accompanying PowerPoint learning module for students where they learn about the volcanic features of Yellowstone National Park. They use spreadsheets to make various calculations, such as the volume of material...
Science Education Resource Center at Carleton College
Serc: The "Perfect" Date: Ranking and Rating Decisions With a Spreadsheet
A lesson plan that includes a PowerPoint learning module for young scholars. The purpose of the lesson is to use spreadsheets to explore a rating and ranking method for choosing someone to date. They look at the problems that arise when...
National Council of Teachers of Mathematics
The Math Forum: A Collection of Secondary Math Units
Teachers of grades 9-12 can explore these seven math units for their classes. Data collection and analysis, problem solving with spreadsheets, and linear transformation are just a few of the topics covered here.
Microsoft
Microsoft Education Lesson Plan: Candy Is Dandy
Explore color distribution of M&M candies using this detailed lesson plan. An engaging integrated lesson that requires understanding of spreadsheets and formulas, and logical reasoning. Links to related websites.
Science Education Resource Center at Carleton College
Serc: Creating a Household Budget
In this Spreadsheets Across the Curriculum PowerPoint module, students create a household budget by tracking their expenditures over a month-long period. Students use Microsoft Excel to create a spreadsheet to track their own...
NC State University
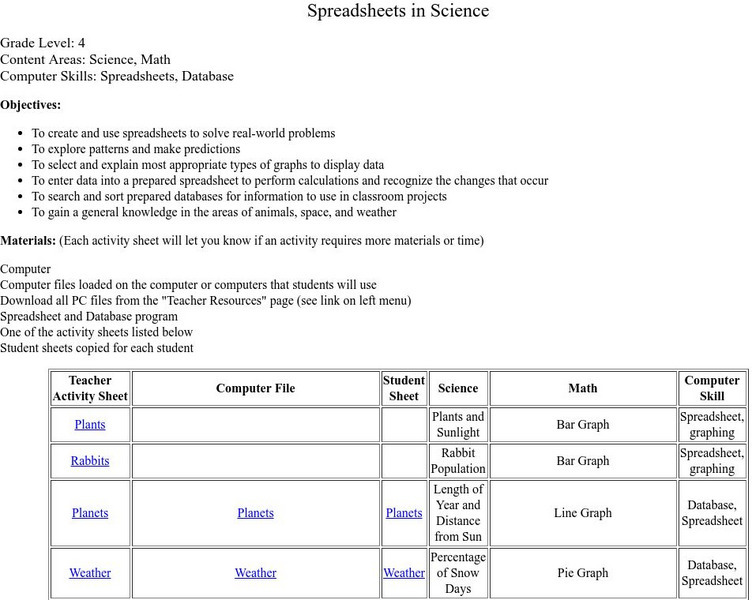
North Carolina State University: Spreadsheets in Science
Intriguing instructional activity from North Carolina State University using a spreadsheet to solve real world science problems. Contains downloadable files for student activities.
Google
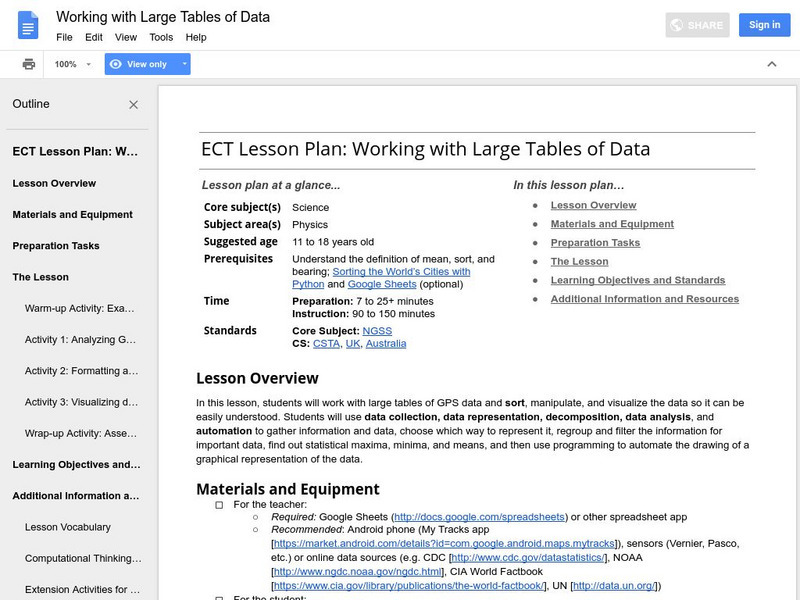
Google for Education: Working With Large Tables of Data
Students work with large tables of GPS data and sort, manipulate, and visualize the data so it can be easily understood.
Google
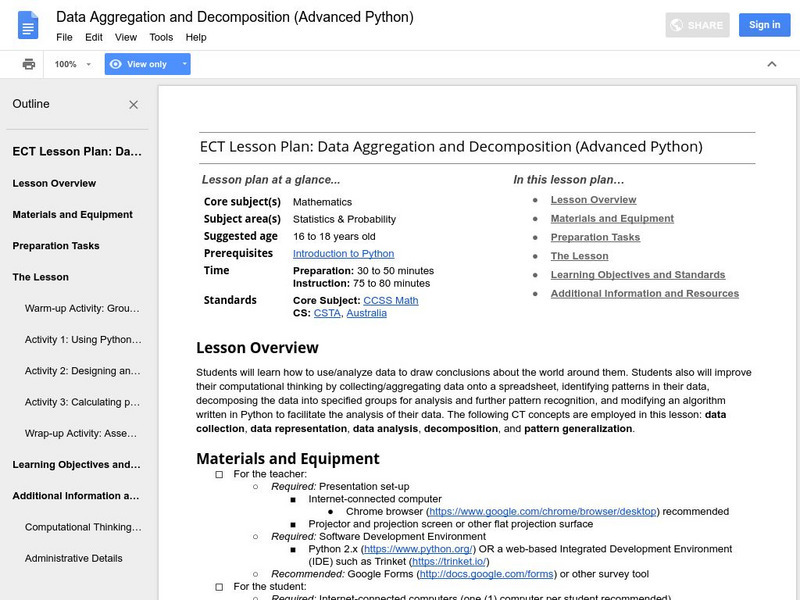
Google for Education: Data Aggregation and Decomposition (Python)
Students learn how to use and analyze data to draw conclusions about information collected from classmates. Then they use computational thinking by collecting and aggregating data onto a spreadsheet, identifying patterns in their data,...
Google
Google for Education: Sorting the World's Cities (Python)
The second of two similar lessons where students learn how a Python program can organize and sort data. When taught in conjunction with Sorting the World's Cities with Excel, students make the connection between writing a program and...
NASA
Nasa: Sea Surface Temperature Trends of the Gulf Stream
Students investigate changes in the surface temperatures of the Gulf Stream over the course of the seasons using data collected by NASA's satellites. The data is inputted into a spreadsheet and graphed.
National Council of Teachers of Mathematics
The Math Forum: Seventh Grade Mathematics: Data Sense
This site has some interesting ways to collect and evaluate data. There are some activities about note taking, spreadsheets, surveys, and a cool bridge construction project. Teachers may want to use this site as a resource for some...
Other popular searches
- Excel Spreadsheets
- Microsoft Excel Spreadsheets
- Meteorology and Spreadsheets
- Using Excel Spreadsheets
- Math Using Spreadsheets
- Heart Rate and Spreadsheets
- Creating Spreadsheets
- Math Spreadsheets
- Using Spreadsheets
- Spreadsheets Charts
- Excel Spreadsheets Graph
- Excel Spreadsheets Planets


