Curated OER
Let's Graph It!
Students graph the height of others in centimeters and inches, find the slope of line in order to calculate the conversion factor between centimeters and inches.
Curated OER
Snowboarding! Join the U.S. Team: Olympics, Math, Weather
High schoolers make weather predictions and observations, research the cost of snowboarding equipment, and use their math skills to plot the course of a Giant Slalom Snowboarding event.
Curated OER
Statistically Lyrical
Students examine and discuss the writing of ratios as fractions and where they can be found in the real world. They complete worksheets and a questionnaire, and calculate the mean, median, and mode scores for the class.
Curated OER
Cruise Conditions Graphing & Statistics
Students monitor weather conditions for an eighteen day period at a specific location. The temperature of both air and water is taken and the mean, median, and mode calculated. Differences between the highest and lowest recordings are made.
Curated OER
US Historical Climate: Excel Statistical
Students import US Historical Climate Network mean temperature data into Excel from a station of their choice. They are guided through the activity on how to use Excel for statistical calculations, graphing, and linear trend estimates.
Curated OER
Descriptive Statistics
Students demonstrate how to use frequency and scatter diagrams. In this statistics lesson, students are introduced to different techniques of representing data. Students sort and graph data on a worksheet and use a frequency diagram to...
Curated OER
Catching the Beat: Exploring the Function of Verse in Othello
Students examine meter and how Shakespeare uses it in dialogue to show character emotion.
Curated OER
Graphing Trigonometric Functions
The student should be able to transfer his knowledge of graphing functions to graphing trigonometric functions. Student should be able to graph trigonometric functions, find amplitude, period, and frequency.
Curated OER
Grating Spectrometer
Students calculate the Balmer series. In this physics lesson, students observe hydrogen lamp spectra using spectrometers. They calculate wavelength and compare them with their theoretical calculations.
Curated OER
Let's Put a Spin on Things: Graffiti Role Play
Fourth graders examine what is and what isn't graffiti. They role-play various scenarios, research the Graffiti Hurts website, and discuss when graffiti should be reported to local law enforcement.
Curated OER
Easy Horizontal Rules
Students create horizontal rule lines with different thicknesses. They create horizontal rule lines with different widths. They create horizontal rule lines without 3D shading.
Google
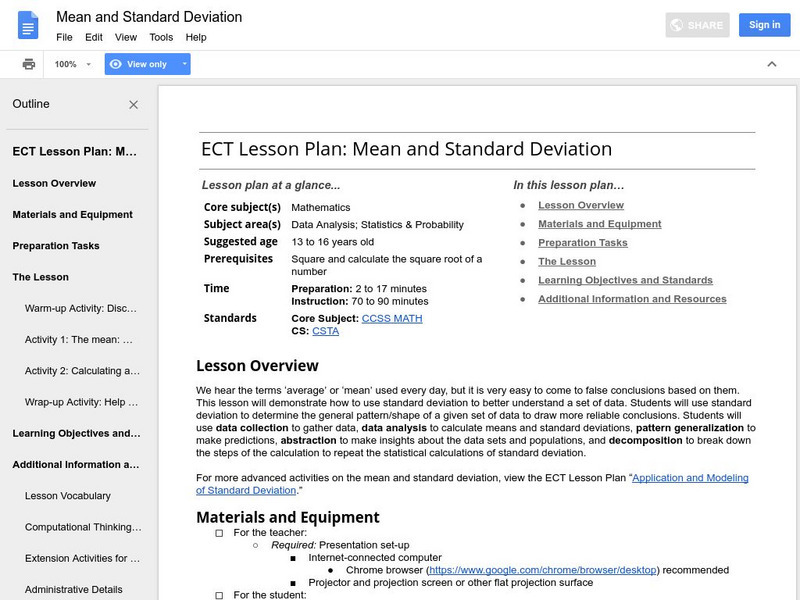
Google for Education: Mean and Standard Deviation
This instructional activity demonstrates to students how to use standard deviation to better understand a set of data. Students use standard deviation to determine the general pattern or shape of a given set of data to draw more reliable...
Illustrative Mathematics
Illustrative Mathematics: Understanding the Standard Deviation
The purpose of this task is to deepen student understanding of the standard deviation as a measure of variability in data distribution. The task is divided into four parts, each of which asks students to think about standard deviation in...
Science Education Resource Center at Carleton College
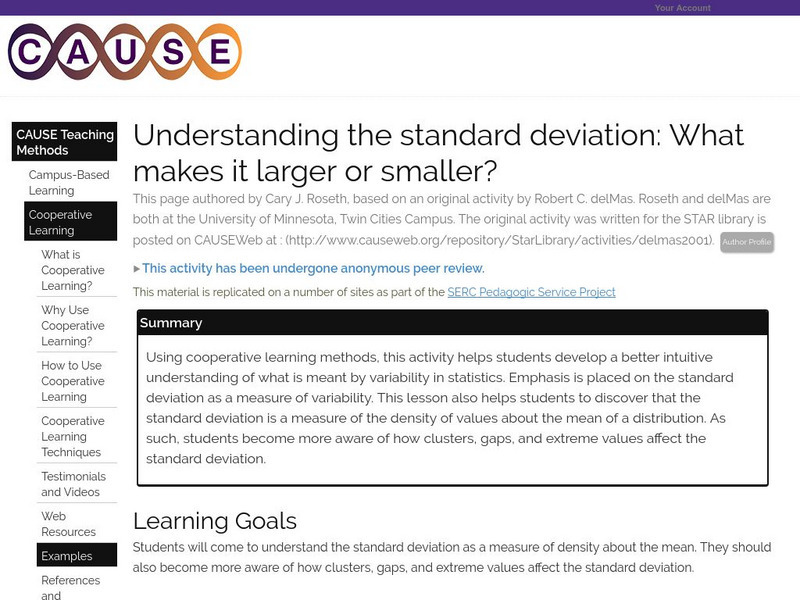
Serc: Understanding the Standard Deviation: What Makes It Larger or Smaller?
Students develop a better intuitive understanding of what is meant by variability in statistics. Emphasis is placed on the standard deviation as a measure of variability.
Google
Google for Education: Application and Modeling of Standard Deviation
Students examine graphs of data using each of the measures of central tendency to determine when to use each in order to get a true overview of the data.
Illustrative Mathematics
Illustrative Mathematics: S Id Sat Scores
Students will find solutions for a series of questions based on the assumption that SAT mathematics scores for a particular year are approximately normally distributed with a mean of 510 and a standard deviation of 100. Explanation and...
Illustrative Mathematics
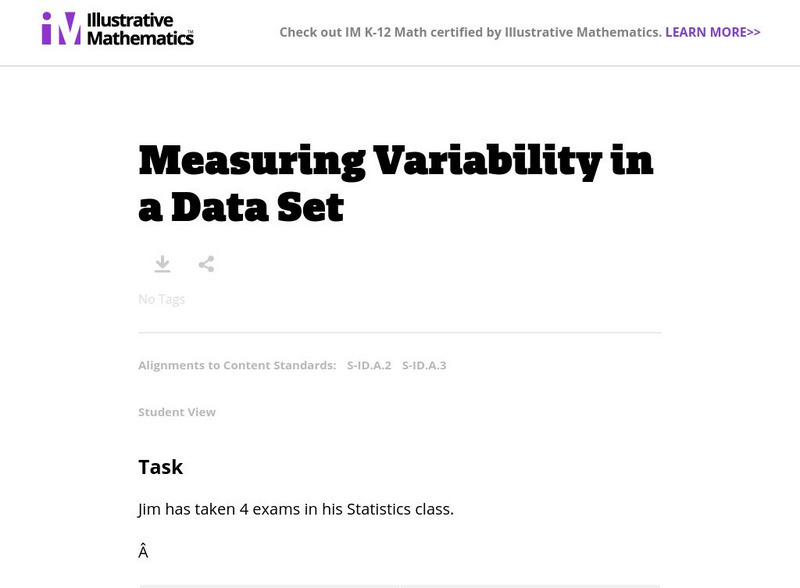
Illustrative Mathematics: Measuring Variability in a Data Set
The purpose of this student task is to develop understanding of standard deviation. Aligns with S-ID.A.2 and S-ID.A.3.
University of Illinois
University of Illinois: Mste: How Much Do Baseball Players Really Make?
An interesting real-world use of statistical variance and standard deviation to help dispell the common perception that all major league baseball players are paid millions of dollars and are not worth it. The lesson plan gives specific...
Illustrative Mathematics
Illustrative Mathematics: S Id.4 Should We Send Out a Certificate?
Should Fred receive a certificate for scoring in the top 2.5% of a statewide standardized test? Given the test scores for a large population and the mean and standard deviation, students will decide if Fred's score is good enough....
Illustrative Mathematics
Illustrative Mathematics: S Id.4 Do You Fit in This Car?
Students are tasked with solving a common issue for automobile manufacturers that require the students to use normal distribution as a model for data distribution. They will also use mean and standard deviation to figure out the problem....
Illustrative Mathematics
Illustrative Mathematics: 8.sp.1 Texting and Grades I
This task looks at a possible relationship between how many text messages high school students send and their grade point average. The data is presented in a scatter plot which students must examine for patterns and deviations. Aligns...
Illustrative Mathematics
Illustrative Mathematics: 7.sp.3,4 College Athletes
Below are the heights of the players on the University of Maryland women's basketball team for the 2012-2013 season and the heights of the players on the women's field hockey team for the 2012 season. (Accessed at...
Other popular searches
- Standard Deviation and Mean
- Mean Standard Deviation
- Math Standard Deviation
- Standard Deviation Z Score
- Chemistry Standard Deviation
- Standard Deviation Computer
- Mean, Standard Deviation
- Standard Deviation Madekine
- Standard Deviation Made Kine


