Hi, what do you want to do?
BBC
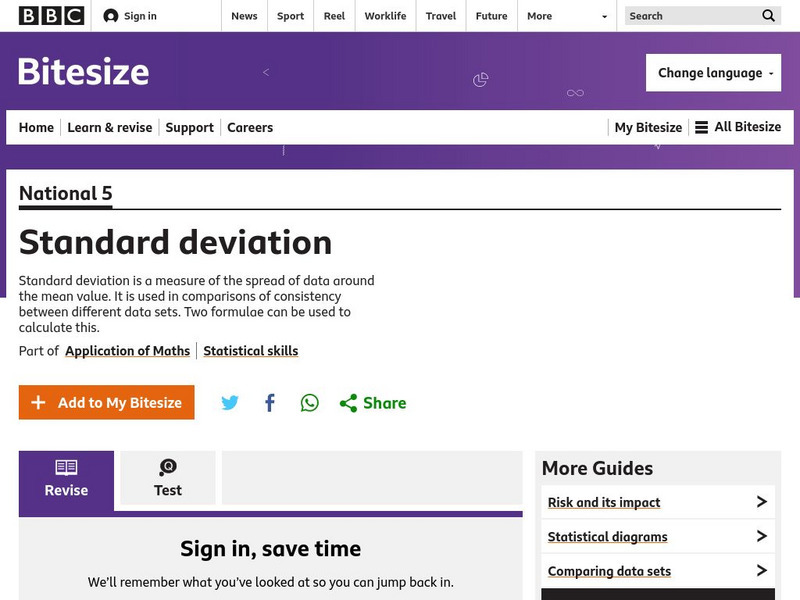
Bbc: Standard Deviation
A demonstration of how to find the standard deviation of a set of data. Several examples and a practice test are offered.
Oswego City School District
Regents Exam Prep Center: Statistical Studies, Central Tendency, and Dispersion
The mathematics tutorial investigates statistical studies, central tendency, and dispersion. The lesson consists of class notes, calculator tips, examples, and practice problems with solutions. The teacher resource includes an activity...
Texas Instruments
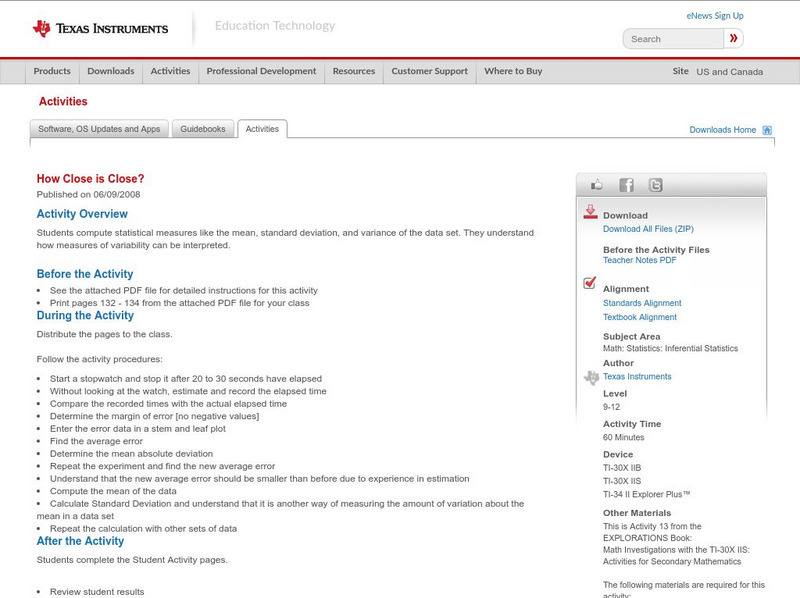
Texas Instruments: How Close Is Close?
In this activity, students compute statistical measures like the mean, standard deviation, and variance of the data set. They understand how measures of variability can be interpreted.
Khan Academy
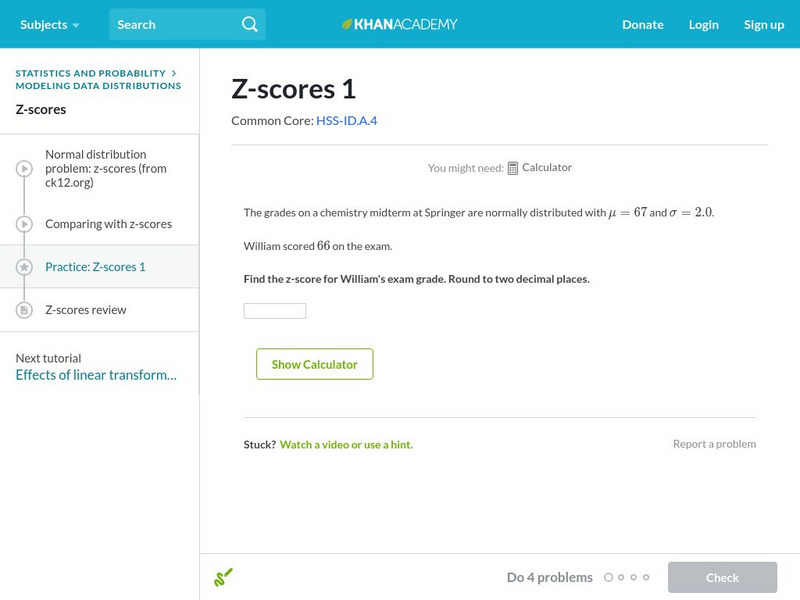
Khan Academy: Z Scores 1
Find the z-score of a particular measurement given the mean and standard deviation. Students receive immediate feedback and have the opportunity to try questions repeatedly, watch a video or receive hints.
Other
Magoosh: Statistics Fundamentals
An online course on the fundamentals of statistics including video lessons in Mean, Median, and Mode; Weighted Averages; Quartiles and Boxplots; Range and Standard Deviation; Normal Distribution; Z-scores; Intro to Inferential...
Missouri State University
Missouri State University: Introductory Statistics: The Normal Curve
Provides lengthy explanations of the measures of central tendencies - mean, mode, and median - and the measures of variability - range, variance, standard deviation - are given here. Graphs of interesting "side items" are presented as...
Illustrative Mathematics
Illustrative Mathematics: S Id.4 Should We Send Out a Certificate?
Should Fred receive a certificate for scoring in the top 2.5% of a statewide standardized test? Given the test scores for a large population and the mean and standard deviation, young scholars will decide if Fred's score is good enough....
Illustrative Mathematics
Illustrative Mathematics: S Id.4 Do You Fit in This Car?
Learners are tasked with solving a common issue for automobile manufacturers that require the students to use normal distribution as a model for data distribution. They will also use mean and standard deviation to figure out the problem....
Annenberg Foundation
Annenberg Learner: Against All Odds: Random Variables
Video presentation on the probability of independent events, covering related topics: multiplication rule, random variable, and mean and standard deviation. [28:41]
Calculator Soup
Calculator Soup: Statistics Calculator
Calculate basic summary statistics for a sample or population data set including minimum, maximum, range, sum, count, mean, median, mode, standard deviation and variance.
Curated OER
Computing Mean, Variance and Standard Deviation
Page centered around a computer program to determine mean, variance, and standard deviation.
Shodor Education Foundation
Shodor Interactivate: Skew Distribution
Change the median and standard deviation of an automatically generated normal distribution to create a skewed distribution, allowing you to observe properties like what it means for the mean, median, and mode to be different.
Texas Instruments
Texas Instruments: Simulation of Sampling Distributions
This set contains questions about simulating sampling distributions. Students see graphs of simulated distributions enabling them to reach conclusions about mean, shape, and standard deviation.
CK-12 Foundation
Ck 12: Algebra Ii: 5.5 Sampling Variability
This section explores the concept of sampling variability in the sample proportion. It will address the effect on the mean and standard deviation of a sample distribution as the sampling size changes.
Shodor Education Foundation
Shodor Interactivate: Measures
Enter data and view the mean, median, variance, and standard deviation of the data set.
Texas Instruments
Texas Instruments: Probability as Relative Frequency
In this activity, students use simulation to justify the concept of the Law of Large Numbers. They understand that as the sample size increases, the relative frequency of which an event occurs approaches the probability of that event...
Khan Academy
Khan Academy: Discrete Random Variables: Expected Value
Compute the expected value given a set of outcomes, probabilities, and payoffs. Students receive immediate feedback and have the opportunity to try questions repeatedly or receive hints.
Other
James Wright: Measures of Central Tendency
This site looks at measures of central tendency and dispersion. Discussed are topics such as standard deviation, mean, median, and mode.
Other
Stat Soft: Statistics Glossary
Dozens of statistical terms are defined and illustrated in this glossary.
CK-12 Foundation
Ck 12: Using Probability to Make Decisions
Use this Common Core Math Standards Browser to search specific math concepts and their corresponding standards. This page focuses on Using Probability to Make Decisions. Click on the links to find lessons, activities, videos, and study...
Khan Academy
Khan Academy: Sampling Distribution of a Sample Proportion Example
Presents a problem that is similar to what might be on an AP Statistics exam. Walks students through each step for solving it and students input answers to questions along the way.
Calculator Soup
Calculator Soup: Variance Calculator
Variance is a measure of dispersion of data points from the mean. Low variance indicates that data points are generally similar and do not vary widely from the mean. High variance indicates that data values have greater variability and...
Other
Meta Calculator: Statistics Calculator
A web-based statistics calculator to find mean, median, standard deviation, variance and ranges.
CK-12 Foundation
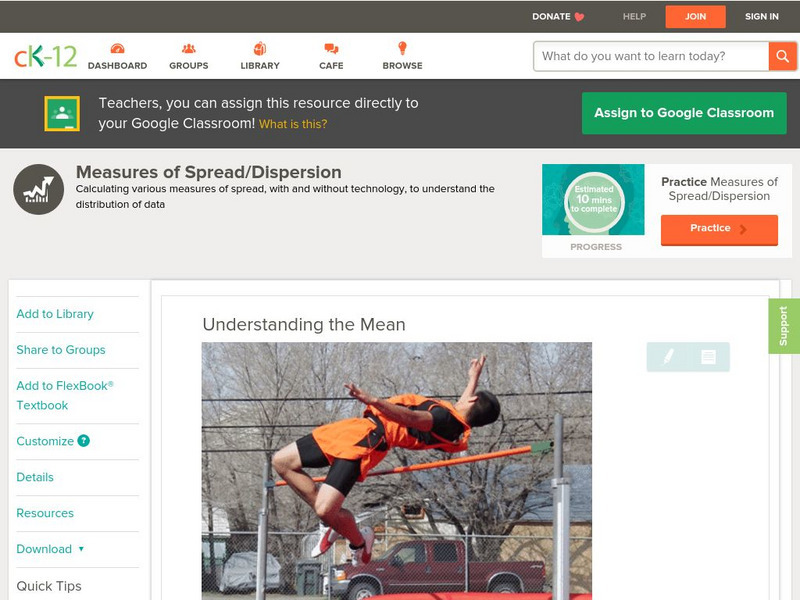
Ck 12: Statistics: Measures of Spread/dispersion Grade 8
[Free Registration/Login may be required to access all resource tools.] Understanding the mean and statistical deviations.


