CK-12 Foundation
Ck 12: Algebra Ii: 5.4 Standard Deviation
Explore what the standard deviation is as it relates to the graph of a normal distribution curve.
University of Colorado
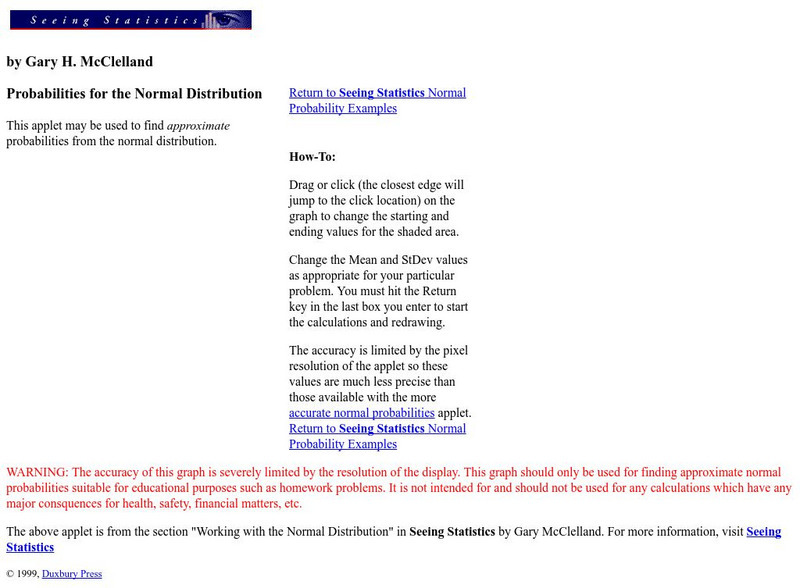
University of Colorado: Normal Probabilities Applet #2
This Applet allows the user to grab and drag the ends of the included region below the standard normal curve to the appropriate places needed. The user directly experiences the connection between the shaded area under the curve and the...
California State University
Cal State San Bernardino: Central Limit Theorem Applet
In this applet, rolling of dice is studied. The number that lands face "up" on the die is graphed as the die is rolled repeatedly. The user begins to see, with increased accuracy, the standard normal curve appearing as the graph.
Texas Instruments
Texas Instruments: Probability Distributions
In this activity, students use the Derive software to compute binomial, hypergeometric, standard normal and normal probabilities, and explore inverse normal computations.
Shodor Education Foundation
Shodor Interactivate: Skew Distribution
Change the median and standard deviation of an automatically generated normal distribution to create a skewed distribution, allowing you to observe properties like what it means for the mean, median, and mode to be different.
CK-12 Foundation
Ck 12: Statistics: Applications of Variance and Standard Deviation
[Free Registration/Login may be required to access all resource tools.] Calculate the variance and standard deviation of a data set.
Illustrative Mathematics
Illustrative Mathematics: S Id.4 Do You Fit in This Car?
Students are tasked with solving a common issue for automobile manufacturers that require the students to use normal distribution as a model for data distribution. They will also use mean and standard deviation to figure out the problem....
Illustrative Mathematics
Illustrative Mathematics: S Id Sat Scores
Students will find solutions for a series of questions based on the assumption that SAT mathematics scores for a particular year are approximately normally distributed with a mean of 510 and a standard deviation of 100. Explanation and...
Vision Learning
Visionlearning: Statistics: Using Mean, Median, and Standard Deviation
An introduction to recognizing trends and relationships in data through descriptive statistics.
Illustrative Mathematics
Illustrative Mathematics: S Id.4 Should We Send Out a Certificate?
Should Fred receive a certificate for scoring in the top 2.5% of a statewide standardized test? Given the test scores for a large population and the mean and standard deviation, students will decide if Fred's score is good enough....
CK-12 Foundation
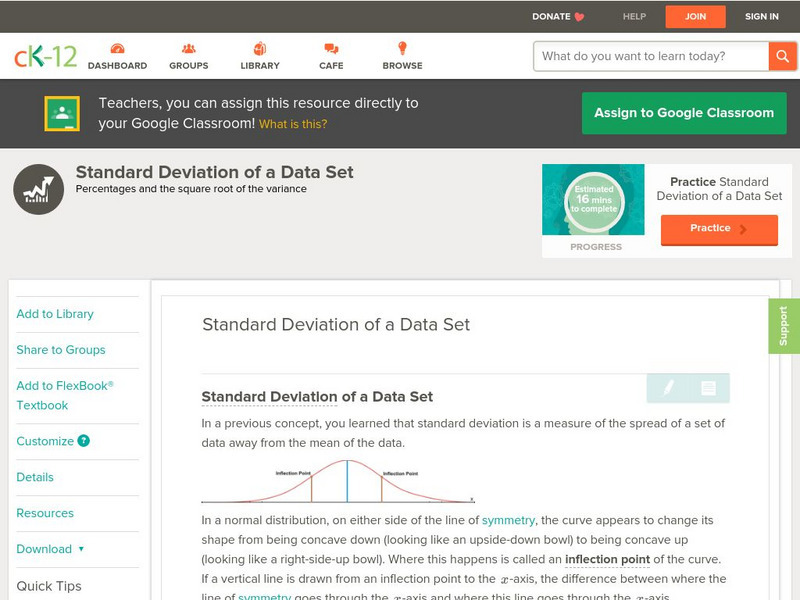
Ck 12: Statistics: Standard Deviation of a Data Set
[Free Registration/Login may be required to access all resource tools.] Learn about standard deviation of normally distributed data.
Other
Magoosh: Statistics Fundamentals
An online course on the fundamentals of statistics including video lessons in Mean, Median, and Mode; Weighted Averages; Quartiles and Boxplots; Range and Standard Deviation; Normal Distribution; Z-scores; Intro to Inferential...
Hofstra University
Hofstra University: Review Exercises Random Variables..
Interactive review problems are offered to practice the concepts of random variables and statistics. Topics covered include, Bernoulli trials, normal and binomial distributions, Chebyshev's rule, and the like.
Other
Stat Soft: Statistics Glossary
Dozens of statistical terms are defined and illustrated in this glossary.
CK-12 Foundation
Ck 12: Statistics: Central Limit Theorem
[Free Registration/Login may be required to access all resource tools.] Introduces students to the Central Limit Theorem. Students will learn about the Central Limit Theorem and calculate a sampling distribution using the mean and...
Khan Academy
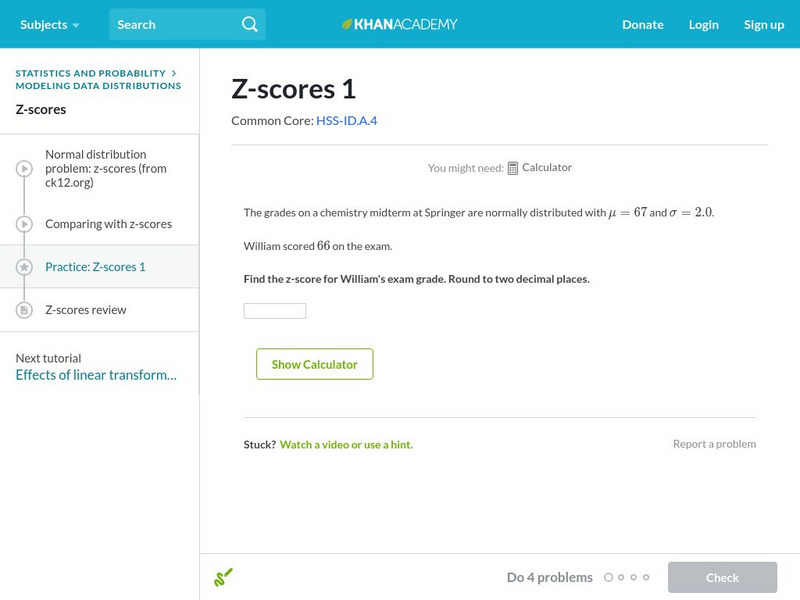
Khan Academy: Z Scores 1
Find the z-score of a particular measurement given the mean and standard deviation. Students receive immediate feedback and have the opportunity to try questions repeatedly, watch a video or receive hints.
CK-12 Foundation
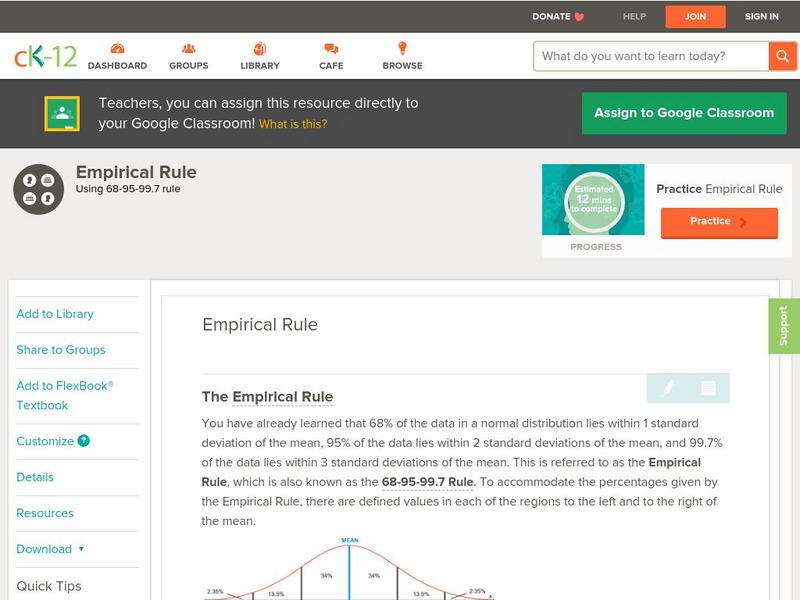
Ck 12: Probability: Empirical Rule
[Free Registration/Login may be required to access all resource tools.] Use percentages associated with normal distributions to solve problems.
EngageNY
Engage Ny: Lesson 19: Analyzing Decisions and Strategies Using Probability
In this lesson, students compare strategies by evaluating the associated probabilities of success. Additionally, problems are included where students are asked whether the result of a probability experiment provides sufficient evidence...
Sophia Learning
Sophia: Practical Applications of the Bell Shaped Curve
Explore the bell-shaped curve and how to calculate a z score. Additional links provided to further knowledge on outliers.
Khan Academy
Khan Academy: Empirical Rule
Practice applying the 68-95-99.7 empirical rule. Students receive immediate feedback and have the opportunity to try questions repeatedly, watch a video or receive hints.
Texas Instruments
Texas Instruments: Using Derive
In this activity, students use the Derive software to solve trigonometric equations, expressions with exponentials, and log equations. They also determine the equation of tangent and normal of a function; evaluate integrals, find area...
Texas Instruments
Texas Instruments: Central Limit Theorem
This set contains questions regarding the Central Limit Theorem. The student sees that, as the size n increases, the shape of the sampling distribution gradually approaches a normal curve, and its population standard deviation decreases.

