American Statistical Association
A Sweet Task
Candy is always an effective motivator! A fun math activity uses M&M's and Skittles to explore two-way frequency tables and conditional probability. The candy can serve a dual purpose as manipulatives and experimental data.
Curated OER
Playing Games
Young scholars participate in games to explore measurement and statistical concepts. They measure distances using standard and nonstandard units and record their measurements in varous tables and use descriptive statistics to report...
Curated OER
Working with Frequency Tables
In this Working with Frequency Tables worksheet, students analyze data that is organized in simple frequency charts. They calculate average from data presented in a frequency table, calculate a cumulative score, and identify data that...
Curated OER
High School Mathematics Problems from Alaska: Cigarette Smoking
Students analyze the monetary cost associated with smoking. Students use statistics to determine life expectancy and cost associated with smoking.
Curated OER
Population Counts
Students investigate the analytical processes used to interpret the 2001 Canadian census. They examine the population statistics and trends.
Curated OER
Musher Graphing and Probability
Students use the internet to research statistical information on the musher dogs participating in the Iditarod. Using the data, they create three different types of pie charts. They use the charts to answer questions about the dogs. They...
Curated OER
The Clumsy Tiler S
Fourth graders solve a series of parallel problems. They use statistics, geometrical, and numerical aspects to solve the problem. Students create a pattern that answers the problem.
Curated OER
Probability Review
Students engage in a lesson that is concerned with the concepts related to probability. They review the key properties of statistics involved in the measurement of probability that includes mean, median, and mode. The lesson includes...
Curated OER
Hypothesis Testing: Claim on Mean; Population Standard Deviation Unknown
For this statistics worksheet, students test given claims using traditional methods of hypothesis testing. Students assume that sampling is randomly generated.
Curated OER
TAKS 3rd Grade Daily Upkeep 6
In this elementary math worksheet, 3rd graders solve 4 problems that focus upon the concepts of statistics, decimal number order, and a word problem.
Curated OER
TAKS 3rd Grade Daily Upkeep 9
In this literacy worksheet, 4th graders practice solving the four problems with a focus upon the skills that include statistics, number order, and word problems.
Curated OER
Using Patterns
For this math worksheet, 6th graders use the time at home in order to work on the skill of recording data in the form of daily activities and statistics.
Curated OER
Play Ball
Students calculate baseball statistics and ball field dimensions. In this Pythagorean Theorem, percentages and metric conversion lesson, students are given formulas to find earned run and batting averages for White Sox baseball players....
Curated OER
Answer to April 2007 Problem
In this math worksheet, students analyze the winner of a mathematician's puzzle and try their hand at the game. This is a matching worksheet where the students review their statistics skills as well as basic math skills.
Curated OER
Investigating: Interpreting Graphs and Analyzing Data
Students explore statistics by researching class birthday data. In this data analysis instructional activity, students investigate the different birthdays among their classmates and create data tables based on the given information....
Curated OER
Financial Planning
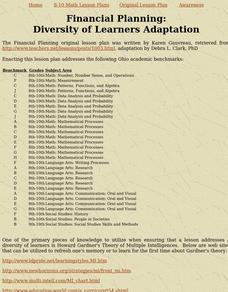
Students participate in activities in order to apply the skills of sound financial planning that includes creating and maintaining a budget. The instructional activity is intended for diverse learners because of the application of The...
Curated OER
What is Probability?
Students participate in a variety of activities in order to understand the concept of probability. The students are engaged because of the application of The Multiple Intelligences Theory.
Curated OER
Pie Charts
In this math learning exercise, students complete the work in order to chart the data into the pie graph. The picture is used for statistical analysis.
Curated OER
Colors Samples
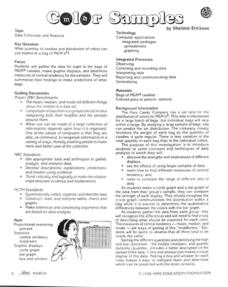
For this math worksheet, students take the time to count out the colors of the candies. They graph the results and make inferences from the information.
Curated OER
Stem and Leaf Tables
For this math worksheet, students examine the order of the data set and create six different stem and leaf tables. The stem is the place value of ten and the leaf is the ones place.
Curated OER
School Population
In this math worksheet, students solve the problem of creating ratios for the school population. There is an example on page 1.
Curated OER
Seasonal Graphs
In this math worksheet, students create a graph using the data recorded from the local newspaper concerning local temperatures.
Curated OER
The Color of M and M's
In this math worksheet, students sort out the colors of candies. Then they count each color and create a flowchart. Finally they create a ratio for each color in comparison to the total number of candies.
Curated OER
Dollar Data
In this math worksheet, students examine a dollar bill in great detail. They record the facts in a data table and then give an oral report of the findings.
Other popular searches
- Data, Census, & Statistics
- Probability and Statistics
- Educational Statistics
- Baseball Statistics
- Math Statistics
- Climate Statistics
- Math Lessons Statistics
- Median and Mean Statistics
- Statistics Lesson Plans
- Sports and Statistics
- Probability Statistics
- Black Plague Statistics


