Sophia Learning
Sophia: Converting Between Odds and Probability: Lesson 1
This lesson demonstrates how to convert between odds and probability. It is 1 of 5 in the series titled "Converting Between Odds and Probability."
Sophia Learning
Sophia: Converting Between Odds and Probability: Lesson 4
This lesson demonstrates how to convert between odds and probability. It is 4 of 5 in the series titled "Converting Between Odds and Probability."
Sophia Learning
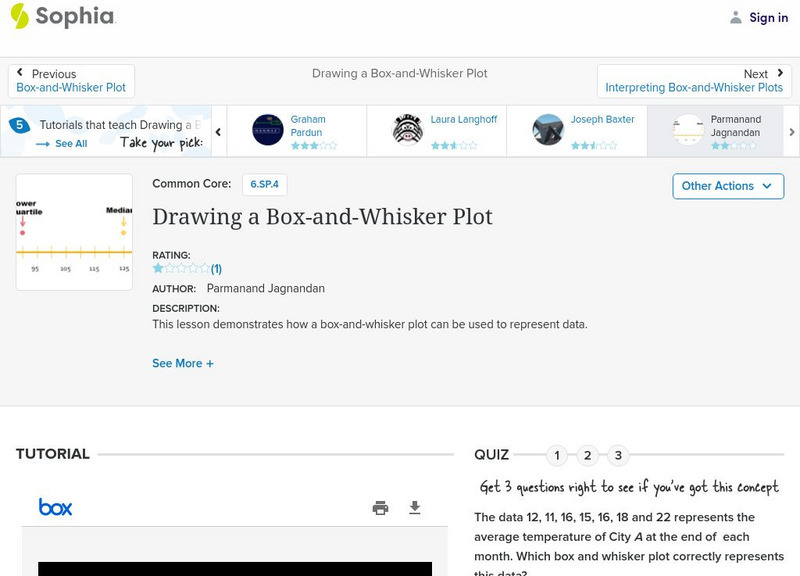
Sophia: Drawing a Box and Whisker Plot
This lesson demonstrates how a box-and-whisker plot can be used to represent data.
Sophia Learning
Sophia: Representing Data With Box and Whisker Plots
This lesson demonstrates how a box-and-whisker plot can be used to represent data.
Sophia Learning
Sophia: Continuous Data
Continuous data is defined and examples are given in this lesson.
Sophia Learning
Sophia: Continuous vs Discrete Data
Explore continuous and discrete data and when to use one over the other.
Sophia Learning
Sophia: Continuous vs Discrete Data
Explore continuous and discrete data and determine when to use each one.
Sophia Learning
Sophia: Discrete Data
Explore the term discrete data and look at examples for further explanation.
Sophia Learning
Sophia: Continuous Data Tutorial
Continuous data is defined and explained in this video.
Sophia Learning
Sophia: Practical Applications of the Bell Shaped Curve
Explore the bell-shaped curve and how to calculate a z score. Additional links provided to further knowledge on outliers.
Stefan Warner and Steven R. Costenoble
Finite Mathematics & Applied Calculus: Uniform Distribution
Students learn about probability density functions and uniform distributions. The tutorial investigates the statistics concepts through class notes and examples. Review exercises are included.
Curated OER
Espn: Billie Jean King
Although she won numerous tennis championships, Billie Jean King will probably always be remembered for her victory against Bobby Riggs in the "Battle of the Sexes". Biographical facts and career statistics are included at this ESPN site.


