Hi, what do you want to do?
Curated OER
Making Sense of the Census
In this unit of lessons, students make sense of the census. They examine why a census is taken and participate in activities.
Science Buddies
Science Buddies: M&m Math
By using a simple bag of M&Ms, you can conduct an experiment in statistics to determine the frequency of colors in the package. The Science Buddies project ideas are set up consistently beginning with an abstract, objective, and...
Science Buddies
Science Buddies: How Do Baseball Stadium Dimensions Affect Batting Statistics?
Here's a fun project that combines baseball and math. Major League baseball is played in ballparks that have their own individual quirks when it comes to the exact layout of the field. Fenway Park in Boston has the famous "Green Monster"...
Other
A River Runs Through It Learning Project
For this year long learning project integrating mathematics and science, students solve environmental problems using data collection and problem solving concepts. Designed for upper elementary gifted students. Interactive components and...
University Corporation for Atmospheric Research
Ucar: Project Sky Math
Teachers will be interested to explore the SkyMath module, and the 16 classroom activities at this site. In this program, students will collect and record real-time weather data to analyze. Data analysis, graphing, number relationship,...
University of Cambridge
University of Cambridge: Maths and Sports: Any Win for Tennis?
What are the probabilities of winning at tennis? This challenging activity is designed to be accessible to students of A-Level Maths (grades 10, 11, and 12).
University of Cambridge
University of Cambridge: Maths and Sports: Archery
Use our interactivity to simulate picking up a bow and some arrows and trying to hit the target a few times. Can you work out the best settings for the sight? This activity gives an opportunity to gather and collate data, and to test...
University of Cambridge
University of Cambridge: Maths and Sports: Who's the Winner?
If two goals are scored in a hockey match between two equally-matched teams, what are the possible scores? This activity gives an opportunity to investigate probability in the context of sport, and is designed to be accessible to...
University of Cambridge
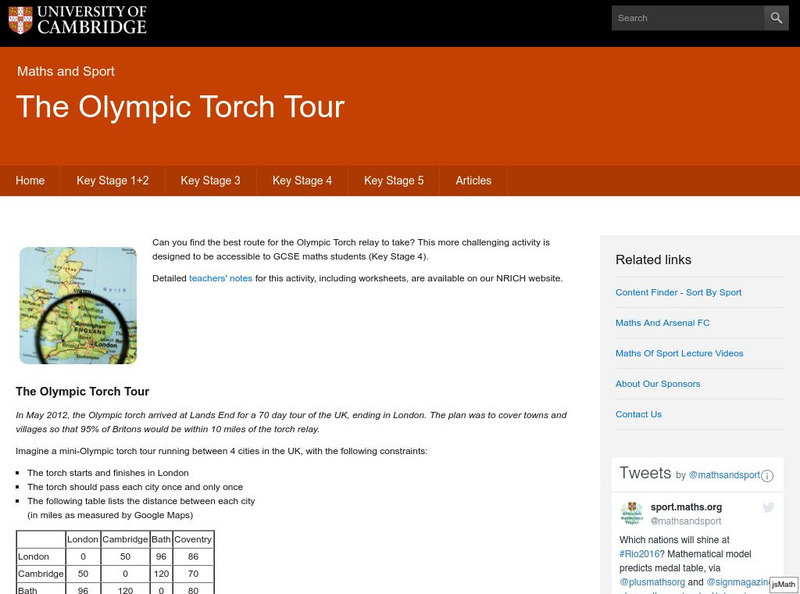
University of Cambridge: Maths and Sports: The Olympic Torch Tour
Can you find the best route for the Olympic Torch relay to take? This more challenging activity is designed to be accessible to GCSE maths students (grades 8, 9, and 10).
Science Buddies
Science Buddies: Career Profile: Statistician
Statistics is a fascinating subject and everyone loves to spout them, but a statistician really knows how to use statistics to answer real-life questions and make predictions based on mathematical data. This Science Buddies site lays out...
Science Buddies
Science Buddies: Estimation and Population Size
Have you ever wanted to take a short cut? How about when doing your math homework? In this experiment you can learn how estimation can save you time doing math calculations. But beware, some estimations are better than others. Can you...
National Council of Teachers of Mathematics
The Math Forum: Data Collecting Project Stats Class
This lesson plan provides the teacher with all the necessary handouts and directions to give a statistics class when they are ready to complete a thorough survey project. Broken into five parts, it takes the young scholars through the...
University of Cambridge
University of Cambridge: Maths and Sports: Charting Success
Sports statisticians, trainers and competitors create graphs, charts and diagrams to help them to analyse performance, inform training programmes or improve motivation. This activity encourages students to consider and analyse...
University of Cambridge
University of Cambridge: Maths and Sports: Our Sports
What events are there in your school sports day, and in the Olympic Games? What are your favourite races and sports? This activity encourages discussion and decisions about how to collect and display data, and is designed to be...
Duke University
Connected Curriculum Project: Matrix Operations: Part 3: Special Matrices
This site explores the properties of several different types of matrices.
University of Cambridge
University of Cambridge: Maths and Sports: Match the Matches
Decide which charts and graphs represent the number of goals two football teams scored in fifteen matches. This data handling activity is designed to get children talking meaningfully about mathematics, presenting and justifying...
Science Buddies
Science Buddies: Baseball Bat Debate: What's Better, Wood or Aluminum?
Science and math abound in baseball. In this project, you can produce some interesting baseball statistics of your own and perhaps settle a long-standing debate. You'll set up experiments at your local playing field to find out which...
University of Cambridge
University of Cambridge: Maths and Sports: David and Goliath
Does weight give shot putters an advantage? This activity encourages students to engage in statistical analysis, and is aimed at GCSE and A-level students (Key Stages 4 and 5).
University of Cambridge
University of Cambridge: Maths and Sports: Drug Testing
The use of performance enhancing drugs is the dark side of sport, and there are stringent measures in place to try to screen athletes. But what's the likelihood that an athlete who fails a drug test has actually taken the banned drug?...
University of Cambridge
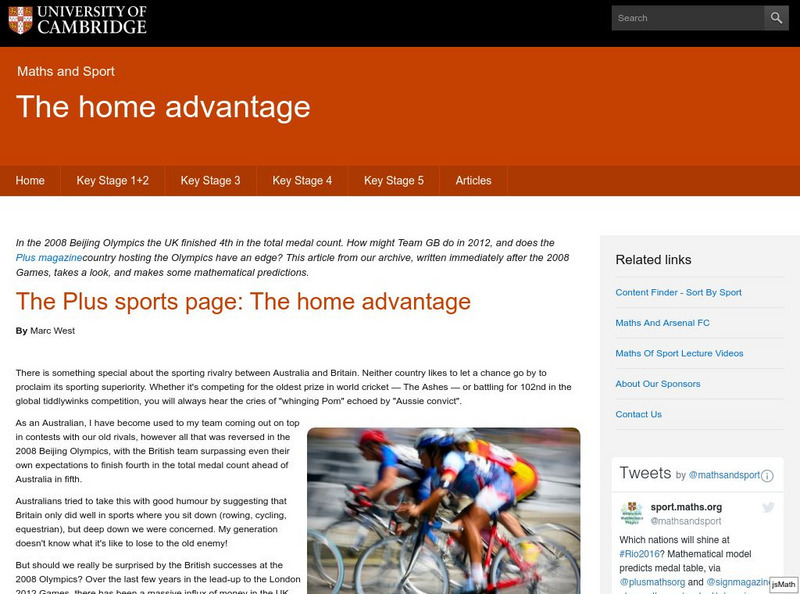
University of Cambridge: Maths and Sports: The Home Advantage
In the 2008 Beijing Olympics the UK finished 4th in the total medal count. How might we do in 2012, and does the country hosting the Olympics have an edge?
University of Cambridge
University of Cambridge: Maths and Sports: What's the Point of Squash?
Squash isn't an Olympic sport (yet!) but it has an interesting scoring system. If you reach 8-all in a game of squash, when should you decide to play to 9 points rather than 10? This activity is a starting point for mathematical...
University of Colorado
University of Colorado: Discrete Mathematics Project: What're the Odds?
This is an activity that may be instructive when trying to learn the concept of "odds" and how they are found.
University of Arizona
Pulse: Health Friendly Energy Production
A cross curricular project where students conduct a moot court to explore the role government policy plays in protecting our health. The focus of the unit is how our power effects our environmental health. Students use their knowledge of...
Alabama Learning Exchange
Alex: My Peanut Butter Is Better Than Yours!
The students will engage in the process of statistical data comparing data using tables and scatterplots. The students will compare data using measures of center (mean and median) and measures of spread (range). This lesson can be done...


