Hi, what do you want to do?
Curated OER
FLIGHT FAIR
Learners conduct their personal investigations into paper airplane flight. Cooperative teams are formed, with students choosing the paper airplane design that they are most interested in building.
Curated OER
Cars on the Curve
Second graders, using two dice, participate in a car race game called Cars on the Curve. They predict which car wins the game and records it in their Data Diary.
Curated OER
Graphing
Students collect data to create different types of graphs-line, pie, and bar graphs. They use StarOffice 6.0 to create graphs.
Curated OER
The Solution to Pollution is Dilution
Students consider what happens to herbicides or insecticides that are used in agricultural practices, especially herbicides that are used to control noxious weeds. They become acquaint with a chemical assessment method known as...
Curated OER
Breakfast Cereal - How Nutritious Is Yours?
Students analyze the nutritional value of breakfast cereal in order to make an informed choice. They create a stem and leaf plot which analyzes the nutritional value of the cereal they eat on a regular basis. Students write a letter to...
Curated OER
Sampling Rocks
Young scholars examine sampling by investigating rocks found in the schoolyard. In this sampling rocks lesson students collect and analyze a sample of rocks.
Curated OER
Using Computers to Produce Spreadsheets and Bar Graphs
Students review graphing terminology and how to plot data points, how to input data into a spreadsheet, and how to make a chart using a computer.
Curated OER
How Sharp Is Your Memory?
Students play a memory game as they explore reasoning. In this algebra activity, students identify concepts using pictures and words. They model real life scenarios using hands on manipulatives.
Curated OER
Harry Potter Research Project
Students work together to complete a research project on Harry Potter. They write a research question and develop a survey to give to their classmates. Using the results, they create a graph and draw conclusions about the data collected.
Curated OER
Leap Frog Experiment
Second graders ask questions and design an experiment to explore different spinners in "The Leap Frog" board game. They conduct their experiment, collect information and interpret the results using a graph.
Curated OER
Dealing With Data
Students collect, organize, and display data using a bar graph, line graph, pie graph, or picture graph. They write a summary describing the data represented and compare the graph to another graph in the class.
Curated OER
Family Activity: Bar Graphs and Line Graphs
In this math worksheet, students work at home with a family member on a graphing activity. Students count the number of cans, glass jars, boxes and bags in the pantry. Students make a bar and a line graph to represent the data.
Curated OER
Eight Integers and Eight Cubes
In this number puzzle worksheet, students are given 8 clues to find 8 integers. Clues refer to measures of central tendencies, abundant numbers, perfect cubes, and palindromes.
Curated OER
How Psychologists Do Research
Students discover how psychologists complete their research on different topics. In groups, they describe the elements of an experiment and the importance of sampling during research. They identify ethical issues in their research and...
Primary Resources
Primary Resources: Mean, Median, Mode, and Range
Here are some teacher resources to aid in teaching mean, median, mode and range. Includes worksheets, games, and PowerPoint presentations.
Ministry of Education, Sports & Culture (Samoa) Government
Mesc: Samoa School Net: Mean, Median, Mode
A 2-part learning module on mean, median, and mode. Explains their definitions and discusses how to choose which term to best describe your data. Includes many well-illustrated examples. (There are a few typos, and money amounts are in...
Math Drills
Math Drills: Statistics and Probability Worksheets
Download these free worksheets to sharpen your skills with statistics and probability. Sheets focus on collecting and organizing data, measures of central tendency (mean, median, mode, and range), and probability.
Calculator Soup
Calculator Soup: Mean, Median, Mode Calculator
Calculate mean, median, mode along with the minimum, maximum, range, count, and sum for a set of data.
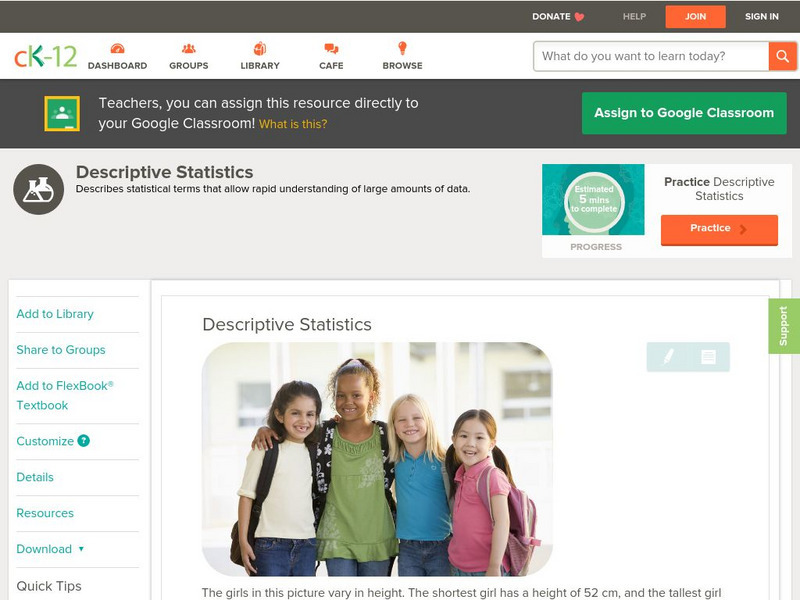
CK-12 Foundation
Ck 12: Physical Science: Descriptive Statistics
[Free Registration/Login may be required to access all resource tools.] Explains descriptive statistics (mean, median, mode, range).
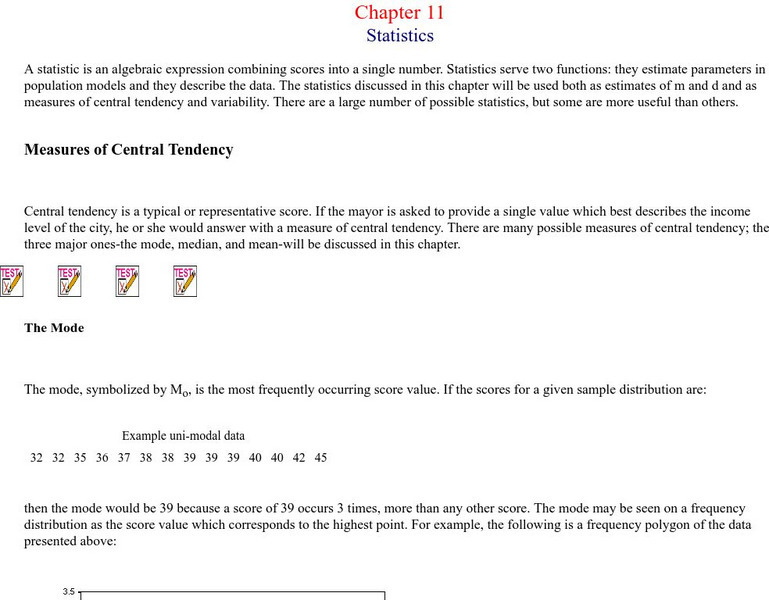
Missouri State University
Missouri State University: Introductory Statistics: Statistics
This is an excellent resource on what the science of statistics involves. There are all kinds of definitions, examples, graphs, and charts to learn from. The topics covered include: mode, mean, median, skewed distributions and measures...
Texas Instruments
Texas Instruments: Data and Statistical Methods 1
In this set of exercises, a set of data is provided; students answer questions about mean, median, mode, and quartiles. Questions are multiple choice with solutions provided.


