Khan Academy
Khan Academy: Normal Distributions Review
Normal distributions come up time and time again in statistics. A normal distribution has some interesting properties: it has a bell shape, the mean and median are equal, and 68% of the data falls within 1 standard deviation.
Missouri State University
Missouri State University: Introductory Statistics: The Normal Curve
Provides a complete discussion of normal curves in statistics. Site is presented in notes with examples added as needed.
Other
West Virginia University: Normal Distribution
The history of the normal curve and its use in statistics is presented. An Applet is provided for the user to adjust the left and right edges of the probability and see the effect on the area under the curve.
CK-12 Foundation
Ck 12: Statistics: Applications of Normal Distributions
[Free Registration/Login may be required to access all resource tools.] This Concept introduces students to applications of the Normal Distribution.
Texas Instruments
Texas Instruments: The Normal Distribution
In this activity, students will apply the normal density function, normal cumulative distribution function, and inverse normal cumulative function to analyze a population with a normal distribution.
Texas Instruments
Texas Instruments: Normal Distribution
This set contains statistics questions regarding the normal curve, its distribution, and its applications. The student, using the correct calculation, transitions between observed x-values, standard z-scores, and normal curve areas.
Texas Instruments
Texas Instruments: Special Cases of Normally Distributed Data
Students perform single and two-sample t procedures to investigate special cases of normally distributed data. They explore inference for a least-square regression line, including the confidence interval.
CK-12 Foundation
Ck 12: Statistics: Density Curve of the Normal Distribution
[Free Registration/Login may be required to access all resource tools.] This Concept expands upon the previous by discussing further the normal distribution and the probabilities associated with it by looking at the normal density curve.
Missouri State University
Missouri State University: Introductory Statistics: The Normal Curve
Provides lengthy explanations of the measures of central tendencies - mean, mode, and median - and the measures of variability - range, variance, standard deviation - are given here. Graphs of interesting "side items" are presented as...
Palomar Community College District
Palomar College: The Normal Curve an Example
A collection of step-by-step worked problems demonstrating how to take a normal curve and determine the probability (area) under it. Hints are provided along the way and the final measures are shown for the user to check.
Other
Fayetteville State University: Z Distributions
The introductory paragraph explains Z-Distributions, their spread, and the ability to find certain values within the distribution. Two animated graphs are then provided as an example of the probability of the normal distribution curve.
Khan Academy
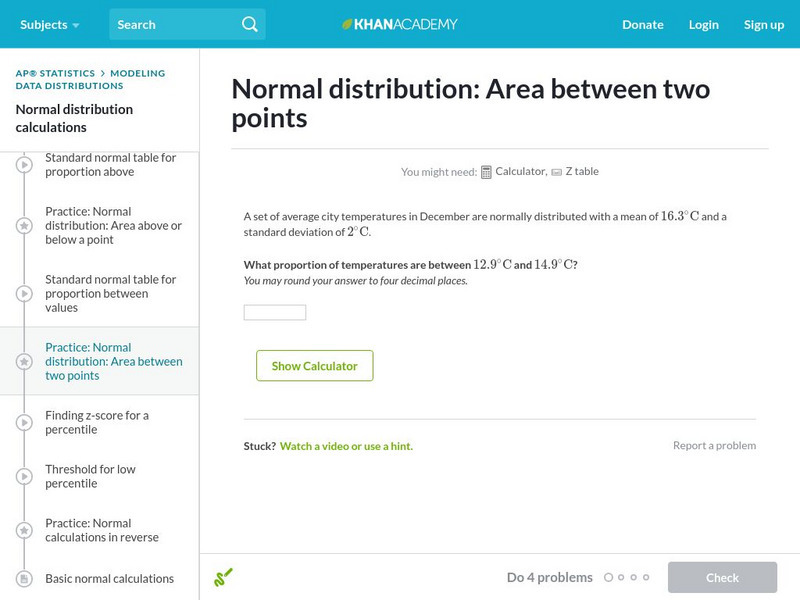
Khan Academy: Normal Distribution: Area Between Two Points
Use a z-table to find the probability that a particular measurement is in a range. Students receive immediate feedback and have the opportunity to try questions repeatedly, watch a video or receive hints.
Khan Academy
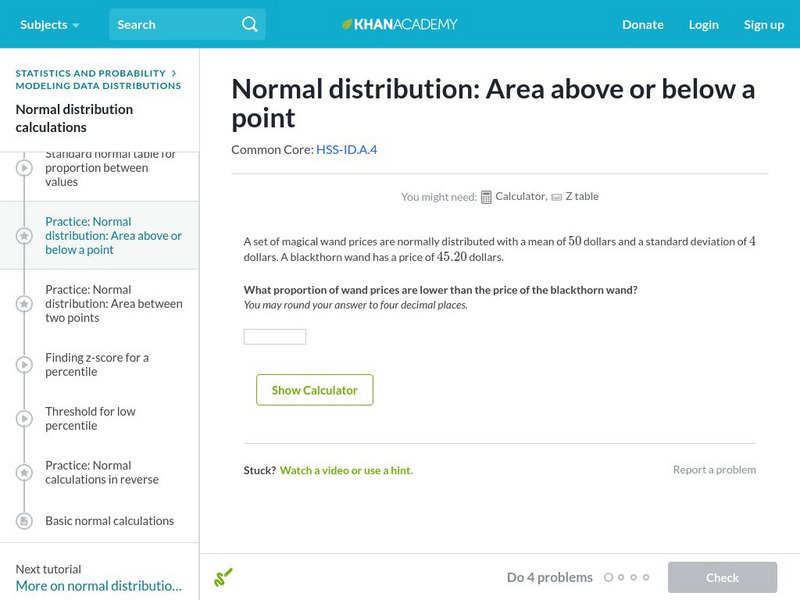
Khan Academy: Normal Distribution: Area Above or Below a Point
Use a z-table to find the probability of a particular measurement. Students receive immediate feedback and have the opportunity to try questions repeatedly, watch a video or receive hints.
University of Glasgow
Steps Statistics Glossary: Normal Distribution
Overview of normal distribution, including the normal distribution model, the probability density function, and standard normal distribution. The parameters for "normal" distribution are provided.
Wolfram Research
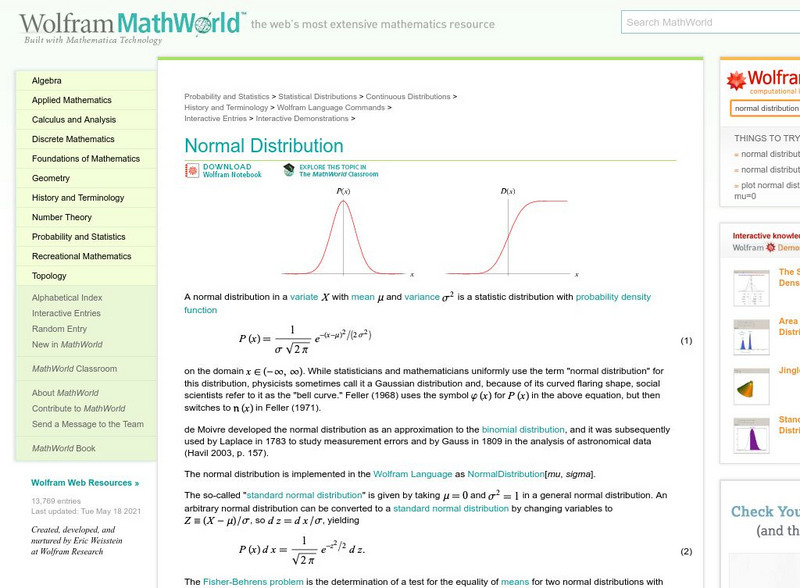
Wolfram Math World: Normal Distribution
Math World explains the normal distribution with links to help with unfamiliar topics and terms. The site explains how to convert from a normal distribution to a standard normal distribution. Some prior knowledge of statistics and normal...
Other
Berrie's Statistics Page: Graph of Normal Distribution
Explanation of the Normal Curve and the importance of the normal distribution
University of Colorado
University of Colorado: Normal Probabilities Applet #3
The Applet illustrates how to use the old-fashioned tables of normal probabilities and areas under the normal distribution cureve to arrive at corresponding graphs of the areas. A good resource for the topic.
Khan Academy
Khan Academy: Basic Normal Calculations
Many measurements fit a special distribution called the normal distribution.
Missouri State University
Missouri State University: Introductory Statistics: T Test: The T Distribution
This discussion of statistical t distributions is presented in notes with examples added as needed.
Texas Education Agency
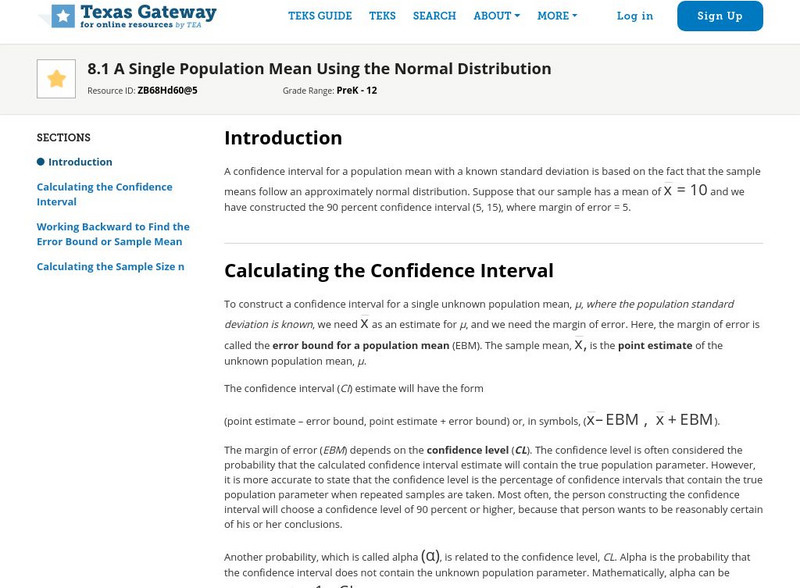
Texas Gateway: A Single Population Mean Using the Normal Distribution
This lesson explains how to calculate and interpret the confidence interval for a population mean. It also looks at the effect on the confidence interval of changing the confidence level or sample size. It then explains how to find the...
CK-12 Foundation
Ck 12: Statistics: Sampling Distributions
[Free Registration/Login may be required to access all resource tools.] This concept introduces the sampling distribution of the mean, inferring the population mean from samples and sampling error.
Other
Statistical Engineering: Central Limit Theorem: Summary
The Central Limit Theorem is the foundation for many statistical procedures since the distribution of the situation being studied does not have to be normal. Here is found a complete explanation of the CLT and graphs supporting the...
Other
Stat Soft: Getting Started With Statistics Concepts
Definitions of the basic concepts in statistics. Great for review and discussion or for introduction into topics.
Annenberg Foundation
Annenberg Learner: Against All Odds: Inside Statistics
The video series shows students the relevance of statistics in real-world settings. The resource includes 26 half-hour videos. Topics include normal distributions, probability, random variables, experimental design, and describing data.


