Texas Instruments
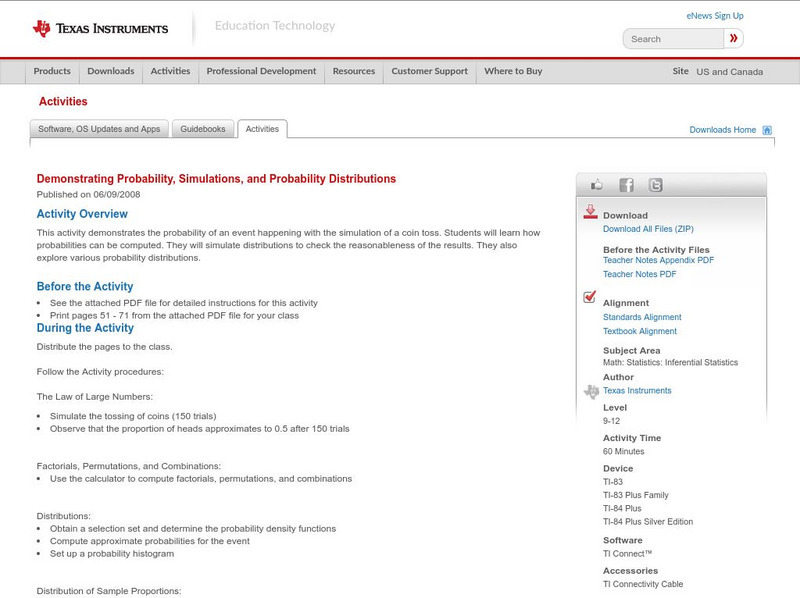
Texas Instruments: Probability, Simulations, and Probability Distributions
Use simulation on the TI-83 graphing calculator to teach students about the distribution of sample proportions, distribution of sample means, the Central Limit Theorem, normal probability plots, and the Law of Large Numbers. Pick and...
CK-12 Foundation
Ck 12: Statistics: Sampling Methods Grade 8
[Free Registration/Login may be required to access all resource tools.] Understanding survey data and methods of sampling.
California State University
Cal State San Bernardino: Bivariate Distribution Applet
The applet is a target at which green darts are shot either with a strict correlation to each other or without -- the user defines this. A good example of how bivariate data is truly influenced by two variables, possibly dependent upon...
CK-12 Foundation
Ck 12: Statistics: Applications of Variance and Standard Deviation
[Free Registration/Login may be required to access all resource tools.] Calculate the variance and standard deviation of a data set.
University of Colorado
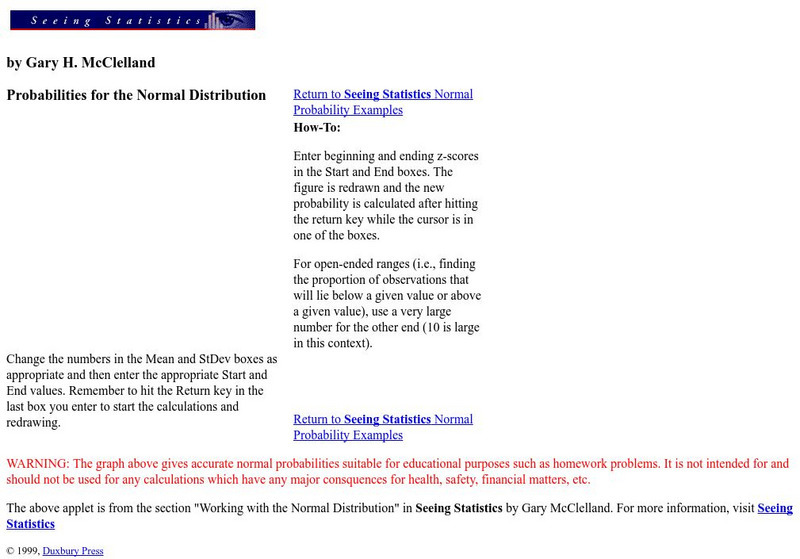
University of Colorado: Normal Probabilities Applet #1
This Applet will assist the user in questions which specify a range of raw scores or z-scores and ask for a probability associated with them.
Beacon Learning Center
Beacon Learning Center: All That Data 2
Students describe graphs and explore range, measures of central tendency, and distribution in this interactive web lesson.
Sophia Learning
Sophia: Practical Applications of the Bell Shaped Curve
Explore the bell-shaped curve and how to calculate a z score. Additional links provided to further knowledge on outliers.
Texas Education Agency
Texas Gateway: Data, Sampling, and Variation in Data and Sampling
This learning module discusses quantitative and qualitative data, the use of two-way tables in marginal and conditional distributions, how to display data, variation in data and samples, and how to critically evaluate statistical...
Other
Fayetteville State University: Z Scores and Probability
Several paragraphs of explanation and graphs are found here to get across the concept of normal scores, z-scores, and the related probability in a simple fashion. This page is part of a collection from the university on basic statistical...
Khan Academy
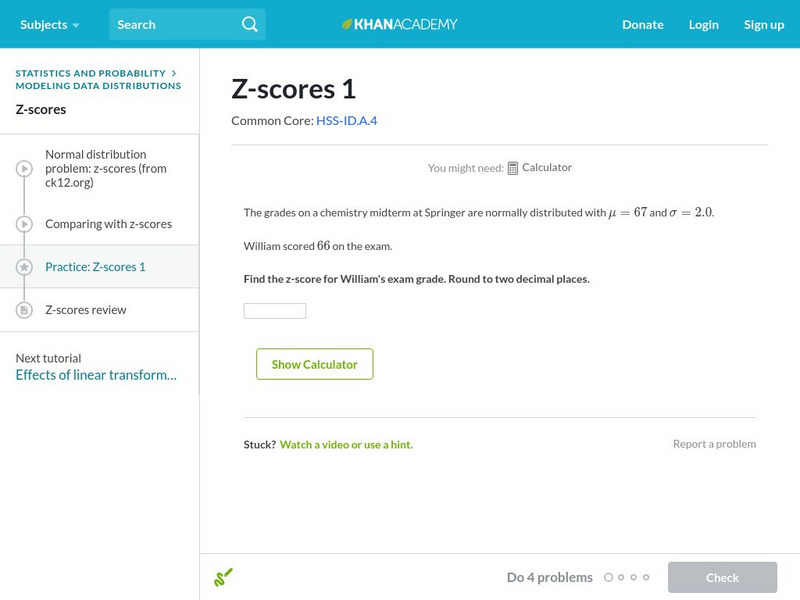
Khan Academy: Z Scores 1
Find the z-score of a particular measurement given the mean and standard deviation. Students receive immediate feedback and have the opportunity to try questions repeatedly, watch a video or receive hints.
Other
Berrie's Statistics Page: Central Limit Theorem
Brief definition and example of the Central Limit Theorem.
Khan Academy
Khan Academy: Transforming Data Problem
It is very common to take data and apply the same transformation to every data point in the set. For example, we may take a set of temperatures taken in degrees fahrenheit and convert them all to degrees celsius. How would this...
University of Manchester
Umist: Mathematical Formula Tables
This site has links to tables of mathematical formulas. To view them, the student must download the formulas in pdf format.
Web Center for Social Research Methods
Research Methods Knowledge Base: Probability Sampling
This site from Cornell University contains great information on random or probability sampling. Definitely a site worth checking out on the subject.
Khan Academy
Khan Academy: Cumulative Relative Frequency Graph Problem
Cumulative relative frequency graph problem.


