Curated OER
Transformation, Reflections, Rotations and Translations
Young scholars create a quilt, using different patterns. In this geometry lesson, students apply prior knowledge as they use different patterns to help them create a quilt using transformations and geometric shapes.
Curated OER
Which Amusement Park Would You Choose?
Young scholars analyze data related to amusement parks and create a spreadsheet to display the data. They read the data and predict which amusement park they think is safer, create a spreadsheet and graph, and write a proposal based on...
Curated OER
The Mean, the Median, and the Mode
In this statistics and probability worksheet, students analyze data to determine the mean, median, or mode as indicated for the given set of data. The four page worksheet contains a combination of twenty-five multiple choice and free...
Curated OER
Quartiles, Percentiles, and Cumulative Frequency
In this statistics lesson, 11th graders are asked to calculate the percentiles, quartiles and cumulative frequency given different graphs and data. There are 6 questions with an answer key.
Curated OER
Graph it!
Sixth graders view a Stacked Graph, and discuss what it shows. Students discuss the basics of graphing: labels, intervals, legends x and y axis... Students create individual stacked graphs from provided information. Students view a...
Curated OER
Infusing Equity Gender into the Classroom
Students investigate if gender makes a difference in the classroom. For this statistics lesson, students collect data on whether equity by gender in the classroom makes students more successful.
Curated OER
Graphing Lesson Plans
By using hands-on graphing lesson plans students can learn how to collect data, and display the information using graphs.
Curated OER
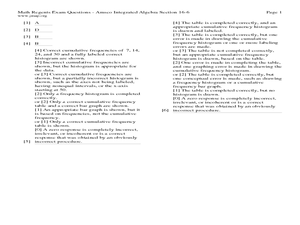
Math Regents Exam Questions - Pearson Integrated Algebra P.304: Histograms
In this histograms instructional activity, students solve 9 short answer, multiple choice, and graphing problems. Students construct frequency tables and histograms of data.
Curated OER
Ready for Roots
Fourth graders sort seeds and predict what conditions are needed for them to germinate. They keep the seeds moist, observe and measure their growth and graph the results. As the seeds start to grow students compare and contrast the each...
Curated OER
Make a Frequency Table and a Histogram for a Given Set of Data
In this data recording and data organization worksheet, students create one frequency table and one histogram for a given list of data. Explanations and examples for frequency tables and histograms are given.
Curated OER
The Hot Dog Stand - An Annual Report
Middle schoolers run a computer simulation and collect data as they work and use the data to create an annual report for their business. It is desirable for students to do this project individually, but it could be done as a class using...
Curated OER
Finding Equations
Learners make equations from everyday data. They create a graph from the equations. Students predict and analyze the results. Learners complete the second scenario on their own and turn in their handout.
Curated OER
Analyzing Graphs and Data
Students collect and analyze data. In this statistics lesson, students graph their data and make inferences from the collected data. They display their data using graphs, bar graphs, circles graphs and Venn diagrams.
Curated OER
Histograms and Bar Graphs
Middle schoolers are introduced to histograms, bar graphs, and the concept of class interval. They use an activity and three discussions with supplemental exercises to help students explore how data can be graphically represented (and...
Curated OER
Sets an the Venn Diagram
Students explore the characteristics of sets and Venn Diagrams. Given data, students practice determining the placement of elements in a Venn Diagram. Students discuss the correspondence between data sets and their graphical...
Curated OER
Mathematical Models with Applications: The Sounds of Music
Students use an electronic data-collection device to model the sound produced by a guitar string. They identify the graph of a periodic situation and use the graph to determine the period and frequency of sound waves.
Curated OER
Comparison of Two Different Gender Sports Teams - Part 1 of 3 Measures of Central Tendency
Students gather and analyze data from sports teams. In this measures of central tendency instructional activity, students gather information from websites about sports team performance. Students analyze and draw conclusions from this...
Curated OER
Graphing Activity
In this probability and statistics learning exercise, students work with a family member to construct graphs based on real life data. The two page learning exercise contains three questions. Answers are not included.
Curated OER
Populations Lab - Exponential Graphing
Ninth graders investigate the application of populations that exists in one's everyday environment, in order to develop an understanding of how mathematics is a key component in the understanding of population dynamics.
Curated OER
Statistical Analysis of Data by Gender
Students examine and identify gender bias, stereotyping, and discrimination in school materials, activities, and classroom instruction. They apply descriptive statistics knowledge to real-world data.
Curated OER
Childhood Obesity
Students identify a question to generate appropriate data and predict results. They distinguish between a total population and a sample and use a variety of methods to collect and record data. Students create classifications and ranges...
Curated OER
Statistics: Misleading or Accurate?
Students explore the concept of misleading statistics. In this misleading statistics lesson plan, students play a game of tag and graph the number of times each student gets tagged. Students use the graph to determine the fastest...
Curated OER
Statistics Newscast in Math Class
Students study sports teams, gather data about the teams, and create a newscast about their data. In this sports analysis instructional activity, students research two teams and define their statistical data. Students compare the two...
Curated OER
Show Me!
Students analyze and interpret graphs. In this graphing lesson, students view a video and construct their own graphs (line, circle, bar) from given sets of data.


