Curated OER
Migration Mania
Learners explore the migratory patterns of four different animals. Reasons for the migration and migratory distances are investigated in this instructional activity.
Curated OER
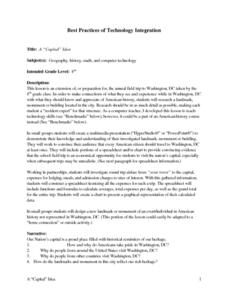
A "Capital" Idea
Eighth graders prepare for a field trip to Washington, DC by researching landmark, monument, or building in Washington. They use the information in small groups to design a multimedia presentation. They include a spreadsheet that shows...
Curated OER
Aqua-Thrusters!
Students construct their own rocket-powered boat called an "aqua-thruster." These aqua-thrusters will be made from a film canister and will use carbon dioxide gas - produced from a chemical reaction between an antacid tablet and water -...
Curated OER
Rings Around the Racetrack
Students determine the number of laps a driver would need to complete the Indy 500. They calculate the length of time it would take to complete the race at different rates of speed.
Curated OER
Reading and Sketching Graphs
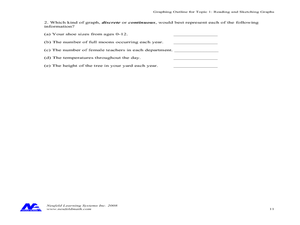
In this graphs worksheet, students answer 15 multistep questions about graphs. Students determine distance traveled, time, velocity, and create scenarios to fit the graph.
Curated OER
Shipping on the Hudson
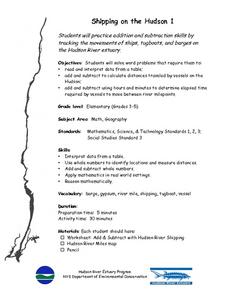
Students track movements of ships, tugboats, and barges on the Hudson River estuary in order to practice addition and subtraction skills. They solve word problems by reading and interpreting data from a table. They calculate distances...
Curated OER
Our Neighborhood in the Milky Way
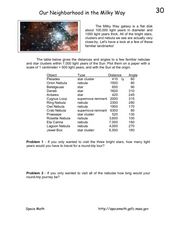
In this Milky Way galaxy worksheet, young scholars are given a table of distances and angles of nebulae and star clusters from the sun. Students plot each one on a piece of paper and solve 2 problems using the data.
Curated OER
Follow the Leaders
Students research the famous Alaskan Iditarod Dog Team Race. They read biographies of notable 'mushers', choose one of 70+ teams and track the daily mileage and location. They keep a journal to record their findings.
Curated OER
Start Your Engines: An Internet Research Lesson
Fifth graders engage in a lesson which offers informational how-tos for conducting research on the Internet. Three search engines are introduced and used to gather information to solve a specific problem.
Curated OER
How Fast Is Fast?
Students make sensible estimates and check the reasonableness of the answers. Students write and solve problems involving decimal multiplication and division. Students perform calculations with time.
Curated OER
Length
Third graders examine and explore a variety of ways to measure length. They discuss how to measure large objects using the end-to-end method, and in small groups measure the length of the room using the end-to-end method with a...
Curated OER
Network This
Students determine the number of paths in a network with up to six vertices. They construct a network to solve a problem situation. They describe and defend the solution to a network problem.
Curated OER
Equations Lesson Plan
Seventh graders play "What's my Rule" beginning with simple equations and working towards harder problems as student's gain confidence. They evaluate the equations by graphing them. Students identify the slope and y intercepts of the...
Curated OER
Particulate Matter: The Lorax
Young scholars explore air pollution. In this ecology lesson, students participate in an experiment in which 5 numbered jar lids are placed outside. Young scholars bring one lid a day in until all jars are inside. Dirt specks are...
Curated OER
Uniform-Motion Problems: Just Playing with Cars
Students explore the concept of the formula for distance. In this formula for distance lesson, students time battery operated cars with constant velocity over 15 meters. Students use the distance = rate x time formula to determine the...
Curated OER
Race the Track! Design Challenge
Students use the design process to investigate physical science. For this force and motion lesson, design a track to achieve a specified outcome. Students complete additional experiments with speed and distance. Students...
Curated OER
Bar Graphs and Pie Charts
Young scholars graph data they collected and analyze it using a bar graph. For this algebra lesson, students analyze their data using pie charts and bar graphs while explaining the meaning to each other. They compare and contrast bar...
Curated OER
Making Paper
Students explore paper making. In this cross curriculum multicultural ecology and art instructional activity, students follow written and oral instructions to make paper using common household items. Students predict the amount of paper...
Curated OER
Our Sky Clock
Students explore space science by completing a worksheet in class. In this astronomy instructional activity, students discuss and identify star patterns in the night sky and relate these patterns to the approximate time they appear....
Curated OER
Buzzy, Buzzy Bee
Students simulate honeybees pollinating flowers. In this pollination lesson, students role-play the process of pollination over the course of several seasons. Students graph results and share their graphs with the class.
Curated OER
So Fast! So Slow!
Fifth graders give examples of objects that move slow and fast. In this physics instructional activity, 5th graders rank animals according to how quickly they move. They create a bar graph of organisms versus rates of speed.
Curated OER
Financial Plans
High schoolers explore financial planning. In this financial plan lesson, students read real-world problems from a current newspaper. They discuss methods for paying off debt, consolidating debt, computing net worth, and increasing cash...
Curated OER
Interpreting Line Graphs
Fifth graders interpret line graphs. In this graphing lesson, 5th graders first begin by reviewing the difference in bar and line graphs and what they are used for. Students practice interpreting the data on various line graphs and using...
Curated OER
How Do Car Engines Work?
Students perform an experiment which simulates what happens inside an internal combustion engine. They explain how the chemical reaction they witnessed is similar to what happens inside the car engine.

