Curated OER
Bar Graphs
Students perform operations and graph their data using charts and bar graphs. For this algebra lesson, students follow specific steps to make a bar graph. They create a survey about people favorite things and plot their data from the...
Curated OER
Graphing
Students investigate graphing. In this bar graph lesson, students view an informational website about graphing, then construct a class birthday bar graph outside with sidewalk chalk. Students choose a survey topic, then collect data and...
Curated OER
How much money can you earn?
Fifth graders survey how to manage money and the importance of it. Students summarize that each day they have the opportunity to earn or lose money. Students provides many situations to present ways of paying bills and money management.
Texas Instruments
REAL LIFE REAL WORLD Activity - Surveyor
Learners investigate surveying in this secondary mathematics lesson. They will explore a real world application of geometry and trigonometry as they create a plot plan using a geometry utility and calculate the area of the land parcel.
EngageNY
Summarizing Bivariate Categorical Data in a Two-Way Table
Be sure to look both ways when making a two-way table. In the lesson, scholars learn to create two-way tables to display bivariate data. They calculate relative frequencies to answer questions of interest in the 14th part of the series.
Mathematics Vision Project
Probability
Probability, especially conditional probability, can be a slippery concept for young statisticians. Statements that seem self-evident on the surface often require a daunting amount of calculations to explicate, or turn out to be not so...
Concord Consortium
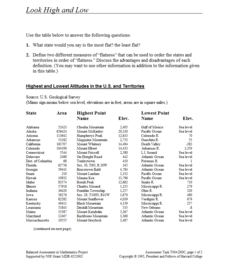
Look High and Low
From the highest high to the lowest low here's a resource that won't fall flat. Given data on the area and the highest and lowest elevations of each of the 50 states, learners decide which states are the least flat and the most flat. Of...
Curated OER
F(x)g(x): A Tale of Two Functions
In this graphing functions worksheet, students solve four problems where they graph given functions, find the sum related to the area under the curve and determine an integral.
Curated OER
Analyzing Data and Finding Bias
In this algebra worksheet, students identify bias as they analyze data. They solve word problems about sampling and surveys. There are 2 questions with an answer key.
Curated OER
Harry Potter Research Project
Students work together to complete a research project on Harry Potter. They write a research question and develop a survey to give to their classmates. Using the results, they create a graph and draw conclusions about the data collected.
Curated OER
Apple Graphing
Students sample a variety of types of apples and then survey each other regarding their favorites. They chart how many students prefer each type of apple.
Curated OER
Bar Graphs
Seventh graders visually represent and analyze data using a frequency table. They recognize what values in a data set are bigger by looking at a bar graph and answer questions about certain bar graphs and what they represent. Students...
Curated OER
Embracing Diversity
Ninth graders discover that the amount surveyed affects the results and conclusions drawn from a survey. In this sampling lesson students explore the concept that a valid conclusion require a large number of entries. Students calculate...
Illustrative Mathematics
Favorite Ice Cream Flavor
What better way to engage children in a math instructional activity than by talking about ice cream? Using a pocket chart or piece of chart paper, the class works together creating a bar graph of the their favorite ice cream flavors....
Curated OER
Getting A Grip On Graphs
Fourth graders gather variety of data and create a graphs to display the data.
Curated OER
Dating Practices
Students interpolate, extrapolate, and make predictions from given information. They present results and conclusions from given data using basic statistics. Pupils create a survey from a critical question and decide which sampling...
Curated OER
Statistical Accuracy and Reliability
Ninth graders assess the accuracy and reliability of current survey data and how it is represented. They design a survey, collect data, and use technology to analyze the data and present the results. Students examine scatter plots and...
Curated OER
Calculating Theoretical & Experimental Probability
High schoolers explore the concept of experimental and theoretical probability. In this experimental and theoretical probability lesson plan, students collect data by conducting a survey of their classmates. High schoolers compare their...
Curated OER
What Do People Know About Radon?
Students complete a survey about how much they know about radon. They calculate the mean scores for each question and graph them. They discuss the results as a class.
Curated OER
Closing the Case
Fifth graders collect data and prepare data displays using a survey with statistical information.
Curated OER
Follow a Bill!
Pupils participate in an activity to discover how a bill becomes law in California. In groups, they create a school program based on their own ideas for change. They develop and conduct a survey within their community and present their...
Curated OER
Using Statistics to Uncover More Evidence
Fifth graders participate in an online Web lesson plan on ways of interpreting data. They conduct a survey and interpret the results in a journal entry.
Curated OER
M&M Statistics
Students determine the difference between guessing and making a prediction. They discuss what they could graph using a bag of M&M's. They take a Raw data sample and convert it into a sample. They graph the actual results and combine...
Curated OER
A Pocketful of Change
Pupils study the meaning, symbolism, and value of U.S. coins,
especially the quarter. They conduct a survey of coins in students'
possession, graphing the results to show frequency distribution and drawing
inferences about the U.S....


