Curated OER
Your Just Desserts
Middle schoolers write letters to town officials and local businesses asking for favorite dessert recipes. They tabulate their responses in a spreadsheet. Students turn their survey results into colorful graphs.
Curated OER
Apple Eaters
Learners sample a variety of apples and graph group results for the class favorites. They orally explain the graph.
Curated OER
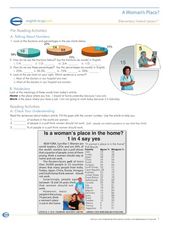
A Woman's Place?
In this women workers lesson, students read an article about women in the workforce and answer 10 questions related to the article. They also convert fractions to percentages.
National Security Agency
Are You Ready to Call the Guinness Book of Records?
Learners design questions that can be answered by collecting data. In this line-plot activity, pupils collect data and graph on a line plot on world records. An abundant supply of teacher support is provided in this resource.
Curated OER
Data and Probability: What is the Best Snack?
In this math/nutrition lesson, the nutritional value of 3 snack foods is recorded on a data chart and represented on a bar graph. Students analyze and compare information, construct data charts and related bar graphs, and draw...
Curated OER
Questioning NASA
Space science and math collide in this inquiry that investigates launching times for antacid-tablet rockets! Upper elementary or middle school learners collect data as they launch these mini rockets. They apply concepts of place value...
EngageNY
Summarizing Bivariate Categorical Data
How do you summarize data that cannot be averaged? Using an exploratory method, learners complete a two-way frequency table on super powers. The subject matter builds upon 8th grade knowledge of two-way tables.
Shodor Education Foundation
From Probability to Combinatorics and Number Theory
What middle schooler does not enjoy an occasional online game? In this lesson plan play, you will find embedded links to an online probability game, and informative pages about how division is used in probability, the concept of tree...
Curated OER
M & M Madness
M&M's are always a great manipulative to use when teaching math. In this graphing lesson plan, learners predict how many of each color of M & M's there are. They count up each color and plug the data into a graph using the...
Curated OER
Unexpected Answers
Students explore the concept of fairness. In this fairness lesson, students play four probability games. Students determine who has the best chance of winning each of the four games. Students discuss which games gave an unfair advantage.
Curated OER
Build a Bar Graph
Learners discover how to use bar graphs. They will gather and organize specific data in order to put it into a bar graph. Then they will answer several questions based on the information they have graphed.
Curated OER
What Can Data Tell Us?
Students explore data distribution. In this data analysis lesson, students create a data distribution table by playing the game "Tower of Hanoi" from the Hall of Science. Students analyze their data and answer data driven questions.
Curated OER
Election Poll, Variation 3
Build on probability and incorporate a random number generator to select outcomes for a school election. Your learners will record their results on a dot plot and answer questions regarding whether their candidate has a chance at the...
Shodor Education Foundation
Replacement and Probability
Middle and high schoolers explore the concept of probability. In this probability lesson, learners conduct an experiment with a bag of marbles. Pupils draw marbles from a bag and determine the probability of drawing a particular color...
Curated OER
Accounting/ Marketing Cookies
Second graders become involved in the advertisement, marketing, and development of their own cookie business. Students must choose a job for the preparation and baking of the cookies. Students also manage the profits and advertisement of...
Curated OER
Seeing Is Believing
Students investigate the concepts of probability. They use data to find the central tendency, median, and mode. Students design and play a game in order to practice the concepts. They also complete a table with data that is analyzed.
Shodor Education Foundation
Introduction to the Concept of Probability
Acquaint mathematicians to the concept of probability with a discussion about the results of a game. Then have them play a dice, card, spinner, or coin game and recording the number of wins vs. the number of tries on an interactive web...
Curated OER
Make a Frequency Table and a Histogram for a Given Set of Data
In this data recording and data organization worksheet, students create one frequency table and one histogram for a given list of data. Explanations and examples for frequency tables and histograms are given.
Curated OER
Data Analysis and Bias
In this probability and statistics activity, students determine when a collected data or a graph of the data could be biased. The one page activity contains four multiple choice questions. Answers are included.
Curated OER
Graph it!
Sixth graders view a Stacked Graph, and discuss what it shows. Students discuss the basics of graphing: labels, intervals, legends x and y axis... Students create individual stacked graphs from provided information. Students view a...
Curated OER
How Many Animals?
Students use their math skills to develop estimates for the population of several animal species native to the Austrailian rainforest. It is a simulation that researchers at the Center for Rainforest Studies in Australia perform to...
Curated OER
Percentages, Fractions and Decimals
In this algebra worksheet, students are asked to convert between percents, fractions and decimals. They calculate interest as it relates to real world scenario. There are 5 a,b,c questions.
Curated OER
M & M Madness
Students work with the mathematics unit of collection, organization, and presentation of data. In this math and technology lesson plan, students use Valentine M & M’s and The Graph Club to sort and graph the various colored M & M’s.
Curated OER
Counting Handout 2
In this counting method, students solve simple and compound probability problems. They determine the number of permutations and combinations that can be made under given circumstances. This two-page worksheet contains 23 problems. ...


