Hi, what do you want to do?
Curated OER
Topic 6: Evaluating and Presenting Results
Students construct spreadsheets from raw data. In this spreadsheet construction lesson, students compile data into Microsoft Excel. Students familiarize themselves with entering and presenting data in a spreadsheet.
Curated OER
Number Line Math
Second graders use a number line to practice subtraction. In this subtraction lesson, 2nd graders use a number line to count backwards. Students participate in mad math activities and solve problems.
Curated OER
Complexity
Students perform mathematical operations on complex numbers. After a lecture/demo, students utilize a worksheet imbedded in this plan to gain practice performing operations on complex numbers.
Khan Academy
Khan Academy: Systems of Equations Word Problems
Solve word problems by modeling them into a system of equations and solving it. Students receive immediate feedback and have the opportunity to try questions repeatedly, watch a video or receive hints.
Concord Consortium
Concord Consortium: Systems of Equations Word Problems 1
Students explore two real-life scenarios that involve solving systems of equations.
Concord Consortium
Concord Consortium: Systems of Equations Word Problems 2
Students explore two new scenarios that involve solving systems of equations. They will improve their understanding of how using mathematics to model a real-life situation with two variables can help them solve problems.
Khan Academy
Khan Academy: Algebra I: Systems of Equations: Age Word Problems
Solve age word problems with a system of equations. Students receive immediate feedback and have the opportunity to try questions repeatedly, watch a video or receive hints.
Khan Academy
Khan Academy: Systems of Equations Word Problems Capstone
Solve word problems that involve systems of equations, where there can either be a single solution, no solution, or infinite solutions. Students receive immediate feedback and have the opportunity to try questions repeatedly, watch a...
Khan Academy
Khan Academy: Systems of Inequalities Word Problems
Solve word problems that involve systems of linear inequalities. Students receive immediate feedback and have the opportunity to try questions repeatedly, watch a video, or receive hints.
Purple Math
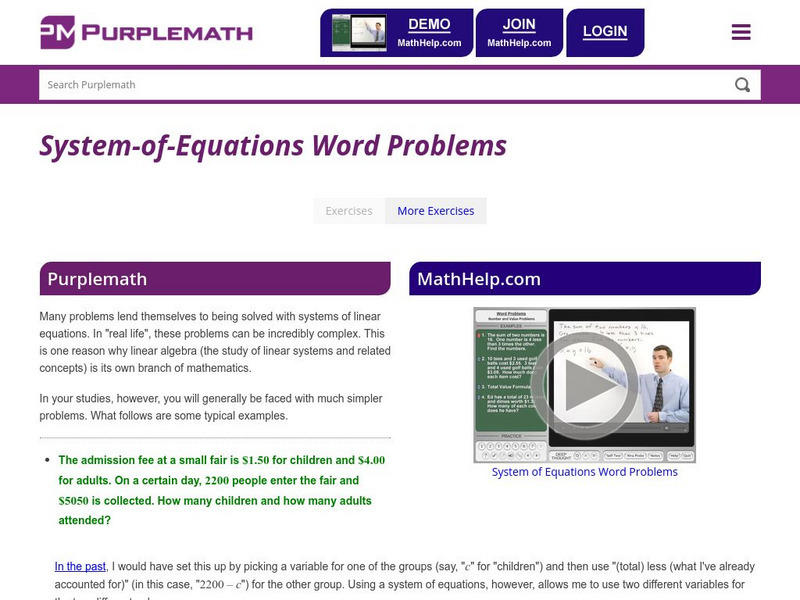
Purplemath: System of Equations Word Problems
This lesson gives numerous word problems with thier solutions for problems with systems of equations. Go to the third problem on the lesson, about half way down the page to find a problem with a quadratic system.
Khan Academy
Khan Academy: Systems of Linear Equations Word Problems
In this exercise, students practice solving systems of linear equations in word problems. Students receive immediate feedback and have the opportunity to get hints and try questions repeatedly.
PBS
Pbs: Pairs of Linear Equations
Use the Visualize It! tool to model word problems. This interactive exercise focuses on solving systems of equations by visualizing the problem or writing expressions then you get to make you own model and write your own word problem to...
Texas A&M University
Wtamu Virtual Math Lab: College Algebra: Systems of Linear Equations
This tutorial will show you a four-step process for solving problems involving systems of linear equations. View several examples of Polya's process of problem solving and hone your own skills with practice exercises.
Lawrence Hall of Science
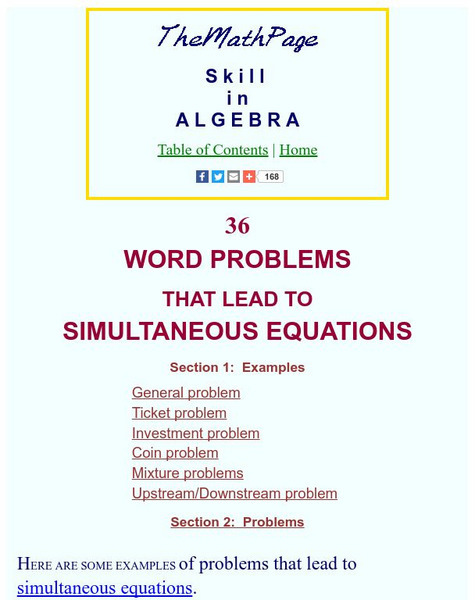
The Math Page: Skill in Algebra: Word Problems That Lead to Simultaneous Equations
Here is a site that clearly and thoroughly explains how to solve word problems that lead to systems of equations, such as mixture, coin, investment, and upstream/downstream problems. There are example problems solved, problems for the...
Math Medics
S.o.s. Math: Algebra
This lesson provides basic instruction on the major concepts in algebra. Content includes a focus on fractions, units of conversion, complex numbers, quadratic equations, factorization and roots of polynomials, solving equations, systems...
Texas A&M University
Wtamu Virtual Math Lab: Intermediate Algebra
This site is a tutorial for students in algebra 2 or for those who need a refresher. The site has explanations, definitions, examples, practice problems and practice tests are found covering topics such as linear equations, graphing,...
Khan Academy
Khan Academy: Equations & Inequalities Word Problems
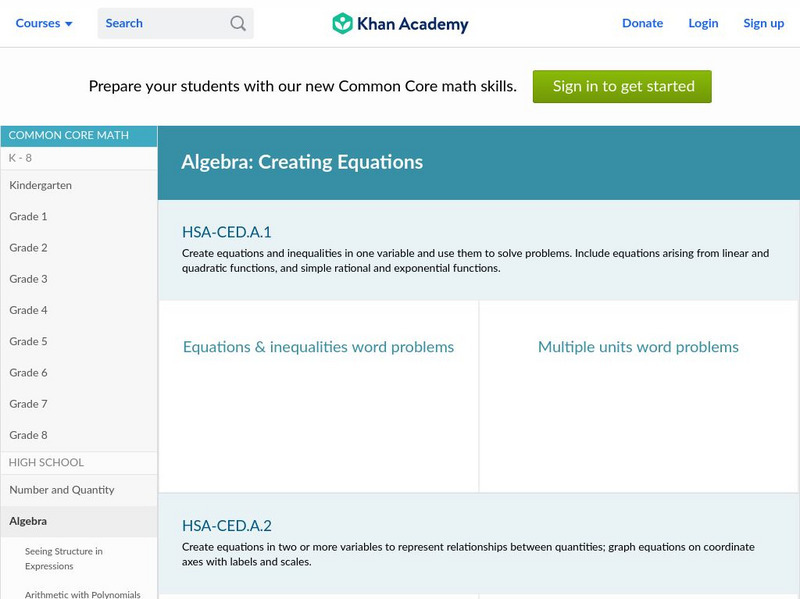
HSA-CED.A.1: Interactive resource which create equations and inequalities in one variable and use them to solve problems. Include equations arising from linear and quadratic functions, and simple rational and exponential functions....
ClassFlow
Class Flow: Applications Using Systems
[Free Registration/Login Required] This flipchart provides guided practice with word problems involving systems of equations and gives a brief review on solving systems of equations.
Texas Instruments
Texas Instruments: Solving Equations
Learn to use the TI-86 to solve many types of equations by following this lesson plan and activity. Included are keystroke instructions and calculator screenprints to guide students.
Hofstra University
Hofstra University: Linear Programming
This lesson is a review of problems with systems of inequalities. Many of the questions involve real world scenarios as word problems which the reader must decipher and resolve.
Khan Academy
Khan Academy: Age Word Problems
In this exercise, students practice age word problems. Students receive immediate feedback and have the opportunity to get hints and try questions repeatedly.
Wolfram Research
Wolfram Math World: Calculus and Analysis
Over two dozen links are provided at this MathWorld site. From Polynomials and Series to Dynamical Systems and Catastrophe Theory, each link provides in-depth explanations and relevant diagrams of the topics at hand.


