Curated OER
A Special Relationship
Students discover the relationships of the lengths of the sides of right triangles and right triangles using a series of drawings on dot paper. They investigate and solve problems of standard (customary and metric units) and non-standard...
Curated OER
Count on Me
Fourth graders use inductive reasoning to find algebraic patterns in geometric figures. They use technology (i.e., calculators, computers) and manipulatives to discover number patterns involving geometric concepts. They solve concrete...
Curated OER
Schoolyard Bird Project
Students observe and count bird sightings around their schoolyard throughout the school year.
Curated OER
Hurricanes
Students research the formation and life-span of hurricanes and, after analyzing statistics, try their hand at plotting and predicting the course a hurricane.
Curated OER
Compass Deviation
Students identify and describe the difference between the magnetic north pole and true north. They consider why sailors could not steer a straight course to the New World from the Old.
Curated OER
Fire Wars
Your class can practice collecting and analyzing data. They extrapolate information and derive data from fire season statistics. They also choose the most appropriate format to display collected data.
Curated OER
What is the Rock Cycle and Its Processes?
Geology beginners examine three different rock samples and determine their origin by their characteristics. By making and recording observations, they become familiar with features of igneous, metamorphic, and sedimentary rock types....
Curated OER
Glided Age
Eleventh graders will participate to brainstorm on the overhead, characteristics of an "irresponsible" adult and 5 of a "responsible" one? How do these differ if we apply these to businesses? Working in partners--Create a Code of Ethics...
Curated OER
How Do You Get to School?
Third graders talk about all the various ways they get to school. They make a list of all the bus numbers that the students use. They also list all the other methods of transportation used and solidify a hypothesis.
Curated OER
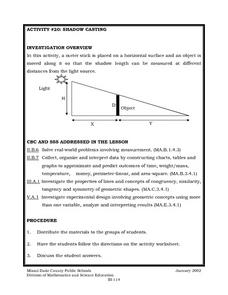
Shadow Casting
Eighth graders use a meter stick that is placed on a horizontal surface and an object is moved along it so that the shadow length can be measured at different distances from the light source. They solve real-world problems involving...
Curated OER
Using the Landscape Picture Map to Develop Social Studies Skills
Enhance your class' geography skills using this resource. Explore a variety of concepts including production and distribution, and people and the environment. Learners make predictions and identify locations on maps. This is a creative...
Virginia Department of Education
Hurricanes: An Environmental Concern
Hurricanes, typhoons, and tropical cyclones are the same type of storm, but their names change based on where they happen. Scholars use a computer simulation to learn about hurricanes. Then they hypothesize ideas to prevent hurricanes...
Curated OER
Michigan Virtual Field Trip
Students analyze data from a virtual field trip to Michigan. They conduct Internet research on mileage and travel time between cities, calculate and compare fuel costs, and research and calculate lodging, activities, and meal costs.
Curated OER
Climate Change
Students compare weather data and draw conclusions. For this climate change lesson plan, students determine whether data collected over a period of ninety years shows a warming trend.
Curated OER
FLIGHT FAIR
Young scholars conduct their personal investigations into paper airplane flight. Cooperative teams are formed, with students choosing the paper airplane design that they are most interested in building.
Curated OER
Cars on the Curve
Second graders, using two dice, participate in a car race game called Cars on the Curve. They predict which car wins the game and records it in their Data Diary.
Curated OER
Venn Diagram and UK Basketball
Students analyze data and make inferences. In this algebra lesson, students collect and analyze data as they apply it to the real world.
Curated OER
The Demographics of Immigration: Using United States Census Data
Students work together to analyze United States Census data on immigration. They compare and contrast the data and determine how immigration numbers have changed over time. They calculate percentages and make their own conclusions...
Curated OER
Weather
Learners create a spreadsheet and chart using data collected. In this weather lesson, students select five cities from their state, including the city they live in. Learners take daily temperature readings from all five...
Curated OER
Anything I Can Do You Can Do Better
Students complete a two-week unit involving design and construction concepts. They watch a PowerPoint presentation about geometric shapes, draw the fourteen shapes incorporated in bridge construction, and in small groups design, build,...
Curated OER
Energy Efficient Buildings
Seventh graders create plans for an energy efficient addition to the school. They work in small groups with each group having responsibility for examining one aspect of the problem. They create working diagrams and a model of their...
Curated OER
Nonfiction Text elements
Students research Lewis and Clark and use the information for a book. In this Lewis and Clark lesson, students gather information and complete worksheets in an activity to write a book. Students use a variety of text features.
Curated OER
Off to Work We Go!
Young scholars create a book about The Great Depression in West Virginia. In this West Virginia history lesson, students visit the West Virginia State Museum, answer questions about West Virginia history, and create a book entitled...
Curated OER
The Big Bang Theory
Students will use scientific reasoning to formulate ideas about the formation of the universe using the Big Bang Theory. The use of critical thinking skills is part of the activity and the foundation of the scientific method will serve...
Other popular searches
- Tables, Charts and Graphs
- Tables Charts and Graphs
- Graphs Charts Tables
- Tables, Charts, Graphs
- Graphs, Tables, Charts
- Maps, Charts, Graphs, Tables
- Charts, Graphs and Tables


