Yummy Math
US Holiday Candy Sales
Candy is a big business! Calculate the amount of money consumers spent on major holidays—Easter, Halloween, Christmas, Hanukkah, and Valentine's Day—based on the total amount of candy sales from 2011 and the percentage of each holiday's...
Curated OER
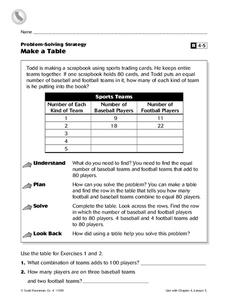
Make a Table
For this charting worksheet, 4th graders complete a table. Using the information provided, students fill in the missing data and complete 2 short answer questions.
Curated OER
Body Chemistry: Using the Periodic Table
For this periodic table worksheet, students use the data chart and the periodic table to solve questions about body chemistry.
Curated OER
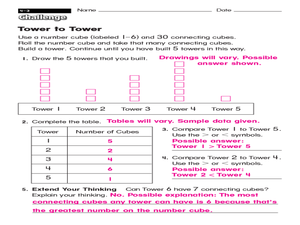
Building Towers with Number Cubes
In this building towers with number cubes worksheet, 2nd graders build number cube towers by rolling a dice, then complete a data chart to compare the number of cubes in each tower.
Mark Twain Media
Understanding Informational Text Features
Everything you need to know about informational text features can be found in this resource. Recognizing these types of text features and how they are used in text allows readers to better understand information. Teachers...
Curated OER
Gases In The Atmosphere
In this science worksheet, middle schoolers look for the amounts of air composition in the atmosphere by filling in the three different data charts.
Other popular searches
- Tables, Charts and Graphs
- Tables Charts and Graphs
- Graphs Charts Tables
- Tables, Charts, Graphs
- Graphs, Tables, Charts
- Maps, Charts, Graphs, Tables
- Charts, Graphs and Tables


