Hi, what do you want to do?
Quia
Ixl Learning: Frequency Tables
Brush up on your math skills relating to frequency tables then try some practice problems to test your understanding.
Microsoft
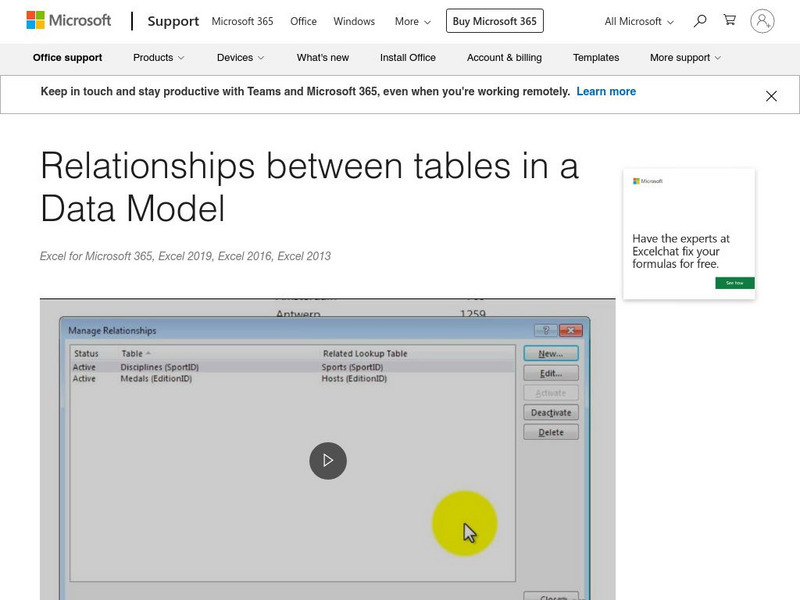
Microsoft: Relationships Between Tables in a Data Model
Add more power to your data analysis by creating relationships among different tables. A relationship is a connection between two tables that contain data: one column in each table is the basis for the relationship. To see why...
Better Lesson
Better Lesson: Graphing Using a Frequency Table
Multiple graphs can represent the same data set and make the information easier to understand.
Alabama Learning Exchange
Alex: "Tables Gone Wild"
What's going on with this "Wild Table?" This lesson is designed to help the learner work collabaratively, creatively as well as separately to properly set the dinner table. This lesson will also infuse ways to make the table relevant to...
Texas Education Agency
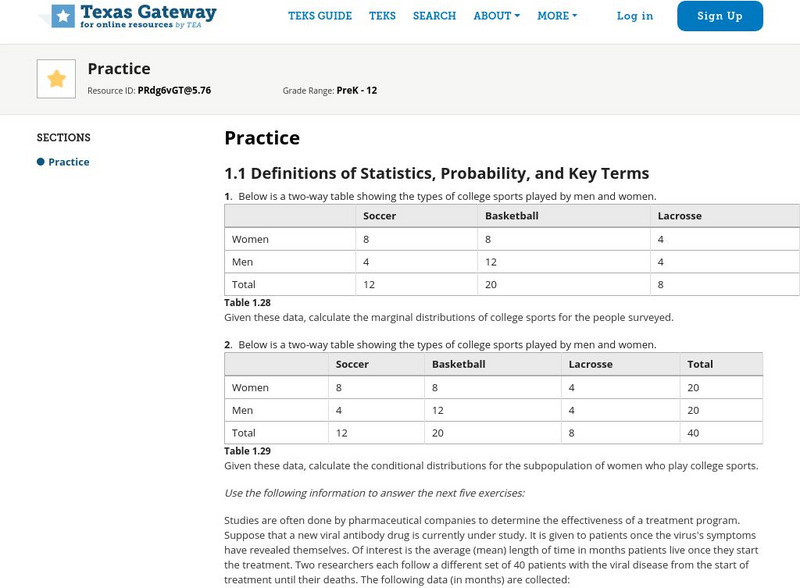
Texas Gateway: Tea Statistics: Sampling and Data: Practice
A set of exercises where learners must analyze statistcal data and methodology and answer questions about distributions, sampling, results, accuracy, frequency, experimental design, and ethical practices.
Shodor Education Foundation
Shodor Interactivate: Two Variable Function Pump
Enter two complex numbers (z and c) as ordered pairs of real numbers, then click a button to iterate step by step. The iterates are graphed in the x-y plane and printed out in table form.
Chem Tutor
Chem Tutor: Chemistry: States of Matter
This lesson focuses on the states of matter: solids, liquids, and gases. It also discusses the Kinetic Theory of Matter, Thermodynamics, Triple point, Phase Change Graphs and the Heating Curve of Water. It provideds adrawing of a heating...
Illustrative Mathematics
Illustrative Mathematics: F Le Basketball Bounces, Assessment Variation 1
This task asks students to analyze a set of data about the height of a basketball for each time it bounces. They choose a model that reasonably fits the data and use the model to answer questions about the physical context. This variant...
Illustrative Mathematics
Illustrative Mathematics: What's Your Favorite Subject
This website provides a task in which students interpret data in a two way table by calculating the relative frequencies of a data set.
Texas Education Agency
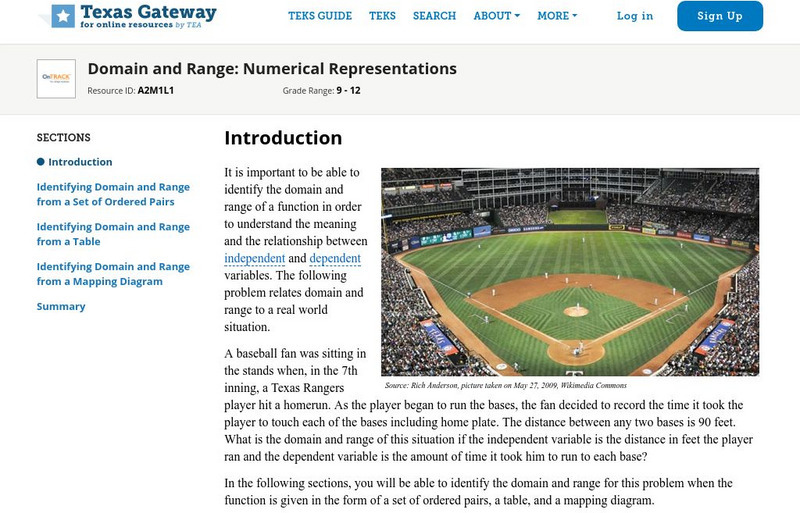
Texas Gateway: Domain and Range: Numerical Representations
Given a function in the form of a table, mapping diagram, and/or set of ordered pairs, the student will identify the domain and range using set notation, interval notation, or a verbal description as appropriate.
Texas Education Agency
Texas Gateway: Tea Statistics: Measures of the Spread of the Data
This resource explains the different measures of center, variability, etc. that are used to describe the spread of statistical data. Includes examples and practice exercises.
PBS
Pbs: Beating Usain Bolt
Use mathematics to determine what is required to beat world champion Usain Bolt in a 200-meter race. This video focuses on systems of equations that are visualized by completing a table of values and looking for a point of intersection...
Other popular searches
- Dining Table Setting
- Dinner Table Setting
- Powerpoint on Table Setting
- Proper Table Setting
- Table Setting and Manners
- Template for Table Setting
- Table Settings Spanish
- Table Setting Etiquette
- Breakfast Table Setting
- Table Setting Practice
- Table Setting Basics
- Table Setting Templates


