Hi, what do you want to do?
US Department of Education
National Center for Education Statistics: Create a Graph Tutorial
This tutorial walks students through how to create different types of graphs using the Create a Graph tool available on the website. Covers bar graphs, line graphs, pie charts, area graphs, scatter plots, and dependent and independent...
ClassFlow
Class Flow: Graphing Lists Tables
[Free Registration/Login Required] This lesson plan flipchart provides opportunities for interpreting information in simple tables and graphs.
Other
Nearpod: Graphing Equations Using a Table
In this lesson on graphing equations using a table, learners will learn how to create a table for a function in terms of domain and range and then graph the function on the coordinate plane.
Khan Academy
Khan Academy: Creating Frequency Tables
In this exercise, students practice creating frequency tables. Students receive immediate feedback and have the opportunity to get hints and try questions repeatedly.
Khan Academy
Khan Academy: Calculating the Median: Data Displays
Practice computing the median of data sets presented in a variety of formats, such as frequency tables and dot plots. Students receive immediate feedback and have the opportunity to try questions repeatedly, watch a video or receive hints.
University of Cambridge
University of Cambridge: Maths and Sports: Match the Matches
Decide which charts and graphs represent the number of goals two football teams scored in fifteen matches. This data handling activity is designed to get children talking meaningfully about mathematics, presenting and justifying...
Better Lesson
Better Lesson: Circle Graph Activity
This lesson will allow the student to work through three stations. The stations will focus on creating and analyzing circle graphs. The students will be using technology to create their graphs along with a hands-on activity using M&M's.
Khan Academy
Khan Academy: The Sat Reading Test: Overview
This is an overview of what to expect on the SAT Reading Test. It assesses your ability to read and interpret a variety of texts similar to the reading you will find in college and your career. All of the questions on the reading test...
Other
Online Statistics Education: Graphing Distributions [Pdf]
This is the second chapter of a statistics e-text developed collaboratively by Rice University, University of Houston Clear Lake, and Tufts University. It looks at many different types of data displays and the advantages and...
University of Cambridge
University of Cambridge: Maths and Sports: Charting Success
Sports statisticians, trainers and competitors create graphs, charts and diagrams to help them to analyse performance, inform training programmes or improve motivation. This activity encourages students to consider and analyse...
US Department of Education
Nces Kids: Creating an Area Graph
This is where you will find step by step directions explaining how to create an area graph. Complete each step and click on the next tab. Directions are simple and clear.
Illustrative Mathematics
Illustrative Mathematics: Color Week
Five-year-olds need to count things that relate to them. This activity builds on their need to be included or see the relevance of their counting. Students will practice counting, writing numbers, and filling in a chart or bar graph....
Discovery Education
Discovery Education: Science Fair Central: Investigation Set Up and Collect Data
A brief overview of how to gather both quantitative and qualitative data, complete with a sample data table.
Other
Bucks County Community College: Visual Organizers
This site walks you through the benefits of visual organizers, and focuses on a variety of types: tables, charts, graphs, timelines, flowcharts, diagrams, and webs.
Oswego City School District
Regents Exam Prep Center: Practice With Organizing and Interpreting Data
Several problems are presented to test your skills in creating and interpreting frequency tables, pie charts, box-and-whisker and stem-and-leaf plots.
Texas Education Agency
Texas Gateway: Data Analysis
Given laboratory investigation data in the form of tables, charts, and graphs, students will analyze and predict trends from the data.
ClassFlow
Class Flow: Interpreting Tables and Graphs
[Free Registration/Login Required] Explore a variety of graphs and tables. Many activities are incorporated to provide practice solving problems using different graphs and charts.
Math Is Fun
Math Is Fun: Data Graphs
Create and customize a bar graph, line graph, or pie chart based on a set of data and print it out.
Alabama Learning Exchange
Alex: Ice Cream Sundae Survey
Students quickly realize the importance of learning how to read and find information in charts, graphs, and tables compared to finding the same information written in a paragraph. This is a fun, high energy lesson!This lesson plan was...
Other
Tulpehocken Area School District: Graphing and Analyzing Scientific Data
Student worksheet with explanation of pie, bar, and line graphs, the parts of a graph, and the definition of mean, median, and mode. This summary is followed by an exercise for each type of graph within a scientific context.
Read Works
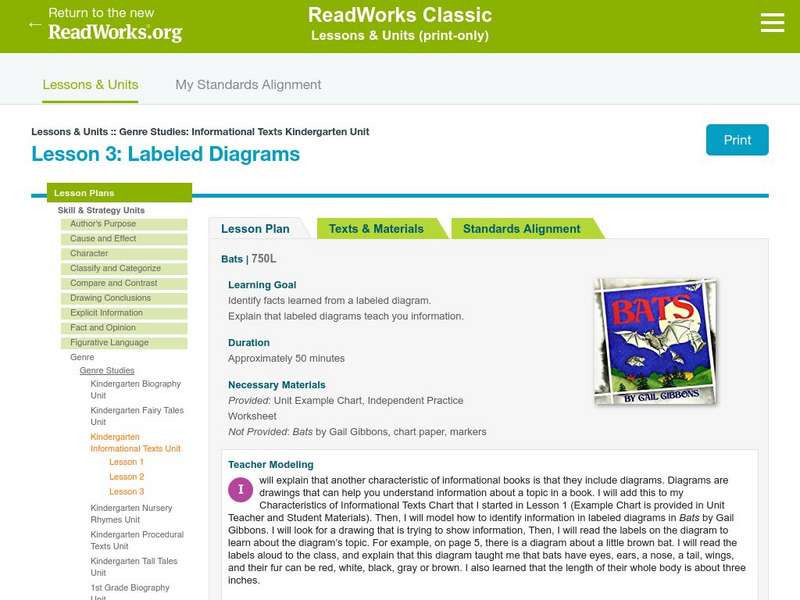
Read Works: Genre Studies: Informational Text Kindergarten Unit: Labeled Diagrams
[Free Registration/Login Required] Lesson uses Bats by Gail Gibbons to teach students how to identify facts learned from labeled diagrams within an informational text. Ideas for direct teaching, guided practice, and independent practice...
Khan Academy
Khan Academy: Comparing Data Displays
Practice interpreting and comparing dot plots, histograms, and box plots. Students receive immediate feedback and have the opportunity to try questions repeatedly, watch a video or receive hints.
Khan Academy
Khan Academy: Creating Dot Plots
Practice creating dot plots. Dot plots are very similar to frequency tables, but they make it easier to see the data. Students receive immediate feedback and have the opportunity to try questions repeatedly, watch a video or receive hints.
Khan Academy
Khan Academy: The Sat Writing and Language Test: Overview
An overview of the SAT Writing and Language Test. Each Writing and Language Test consists of four passages with 11 questions each. You will have 35 minutes to complete the Writing and Language Test.


