Curated OER
Busted Bubbles
Using the scientific method, and bubble gum, learners conduct a motivating experiment. After conducting a series of tests involving bubble gum, they graph and analyze their results. This is the type of activity everyone loves.
Curated OER
Quantum Mechanics
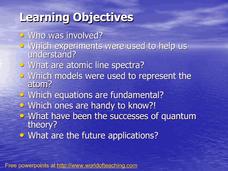
Mostly what you will find here is a history of quantum mechanics. Influential scientists are introduced (along with some of their recorded quotes), the progression of atomic models is reviewed, and finally experssions and equations are...
Curated OER
The Who's Who of Quantum Physics
This wonderful recap of powerful figures in scientific history includes pictures, important dates, and the information about their inventions or impact. Atomic structure and the photoelectric effect are introduced. The first slide gives...
Curated OER
Types of Graphs
Fifth graders construct graphs. In this graphing lesson, 5th graders learn about various types of graphs such as bar, line, circle, picture and stem and leaf plot. Students work in groups to create examples of each graph.
Curated OER
Collecting Data
In this data collection worksheet, students read about how data is collected and organized. They also learn about a hypothesis. Students read through examples of different charts and then answer 23 questions pertaining to data...
Curated OER
Mean, Median and Mode
Fourth graders describe weather data using the mean, median and mode. For this mean, median and mode lesson, 4th graders understand how to calculate data using mean, median and mode and why they would use each one.
Curated OER
Introduction to Probability
For this probability worksheet, 11th graders review basic probability concepts such as chance, probability lines, and possible outcomes. There are 6 problems on here.
Curated OER
My Test Book: Story Problems
In this math skills practice worksheet, students solve 10 multiple choice math problems that require them to respond to story problems.
Curated OER
Data Collection and Presentation
Students concentrate on discrete quantiative data. They are shown that the vertical line diagram as a more appropriate way to present discrete quantiative data then bar charts. Students work as a group to help with the interpretation...
Curated OER
Questionnaires and Analysis
Students, review the techniques and different types of data analysis as well as how they are expressed, identify why facts and data are needed in conclusion of a questionnaire. The concepts of qualitative and quantitative data are...
Curated OER
Lesson 4: A Class Census
Students compile results in their own census. For this early childhood U. S. Census lesson plan, students collect and represent information about events in simple charts.
Curated OER
Understanding Statistics
In this statistics worksheet, students examine and interpret pictographs and line graphs. Students analyze the provided data in order to create bar graphs, circle graphs, and box and whisker plots. The nine page worksheet accompanies a...
Curated OER
Graphing Data
First graders explore the concept of graphing. In this data lesson, 1st graders gather information from a class survey and display their findings on a picture graph. Students also practice solving problems that their instructor models.
Curated OER
Organizing Data
Third graders investigate ways to organize data. In this tally marking lesson plan, 3rd graders practice drawing tally marks to represent an item of data. Students also make connections with skip counting by fives.
Curated OER
Letter Survey
In this letters worksheet, students complete a tally table of the most letters written in English and answer questions about them. Students complete 10 sections of the tally table and answer 4 questions.
Curated OER
Holly Leaves
Sixth graders analyze mathematics by participating in a botany activity. For this holly lesson, 6th graders identify if all holly leaves have the same amount of prickles by conducting a math survey. Students analyze many leaves and...
Curated OER
Skittles, Taste the Rainbow
Fifth graders learn and then demonstrate their knowledge of a bar and a circle graph using the classroom data. Students are given a pack of skittles candy. Students create a bar and circle graph indicating the results of the contents of...
Curated OER
Data and charts
In this data and charts worksheet, students answer multiple choice questions referring to different charts about mountain heights, breakfast drinks, and more. Students complete 10 multiple choice questions.
Curated OER
Zoo Favorites
First graders construct a class picture graph and tally grid that show their favorite zoo animals. They discuss the information the graphs show and complete a personal graph based on the class example.
Curated OER
The Human Line Plot
Fifth graders collect data and use charts and line plots to graph data. Through class surveys, 5th graders collect data concerning a particular subject. They graph their data using a line graph. Students make inferences and predictions...
Curated OER
How Many Ice Creams?
Students discuss their favorite ice cream flavors and read the math problem. They brainstorm the problem and brainstorm for ways to solve the problem. Students work in pairs and share solutions.
Curated OER
Calendar Math
In this math worksheet, students solve the problems that are related to reading and interpreting the calendar for the different parts.
Curated OER
Bar Graphs
In this bar graphs worksheet, pupils, working with a partner, explore how to read and analyze the five answers to one mathematical bar graph.
Curated OER
A Turkey for Thanksgiving - Lesson #2
Second graders investigate realistic fiction, holiday celebrations, making tally charts. In this multi-disciplinary lesson, 2nd graders listen to a story about Thanksgiving and one about the Chinese New Year to develop an understanding...
Other popular searches
- Tally Charts
- Tally Charts and Pictographs
- Tally Charts and Tables
- Tally Charts or Pictographs.
- Math Tally Charts
- Primary Tally Charts
- Sorting and Tally Charts
- Tally Charts Mode
- Using Tally Charts
- Lucky Charms Tally Charts
- Birthday Tally Charts
- Tally Charts Lesson Plans


