Curated OER
Metropolitan Areas in the USA
Fifth graders explore why people live in certain regions of the United States. They investigate information on specific metropolitan areas such as temperature, population, natural resources, precipitation and landforms. In groups, 5th...
Curated OER
Vowels, Reading Fluency
Third graders practice identifying words with the short o vowel sound. They use the strategy will reading a page from The Hare and the Tortoise. They read the passage while focusing on increasing their reading fluency and practice...
Curated OER
Mother May I?
Third graders measure distance using nonstandard units of measure. In this measurement lesson, 3rd graders measure a given distance through the use of the game "Mother May I?" Student gather and compare data on how many "giant steps" and...
Curated OER
Graphing Words Word Search
In this data vocabulary worksheet, students search for 16 graph-related words in a word search grid. Each word relates to graphing and collecting data.
Curated OER
A Game of Scrabble
For this secondary mathematics worksheet, students determine each word played during a Scrabble game. They are given a mat clue for each word played and determine the correct placement on the board and the score at the end of the...
Curated OER
Scrabble Problem
In this secondary mathematics worksheet, students use clues to determine each word and the correct placement of each word played in a Scrabble game. The one page worksheet contains one problem. Answers are not provided.
Better Lesson
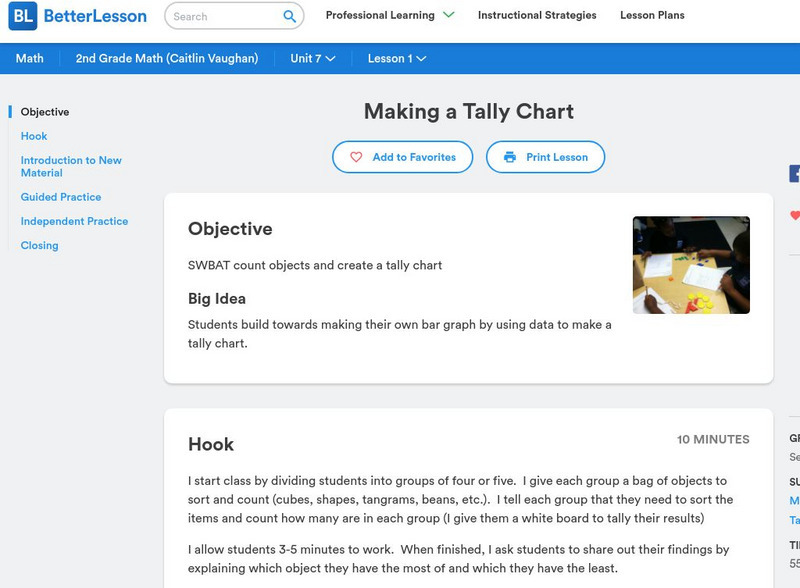
Better Lesson: Making a Tally Chart
Second graders build towards making their own bar graph by using data to make a tally chart.
Wolfram Research
Wolfram Math World: Frequency Distribution
This site from MathWorld provides a general overview of frequency distribution, complete with a bar graph and explanatory text.
PBS
Pbs: Math With Jake: Frequencies & Pitch
In this video, musician Jake Shimabukuro uses the pitch of musical notes and vibrations in hertz to illustrate the concept of ratios. This clip is from Center for Asian American Media. In the accompanying classroom activity, students...
Better Lesson
Better Lesson: Building Our Own Bar Graphs (Part I)
Second graders use data to create a tally chart and make a bar graph. This lesson includes a detailed plan, videos of students engaged in the lesson, and printable worksheets.
Other
Quiz Tree: Sight Words: Pre Primer Chart
Students' have access to a pre-primer chart that provides an audio of each word when clicked.
ClassFlow
Class Flow: Tally Chart
[Free Registration/Login Required] The teacher will use this lesson plan to review tally charts. Students will use alternative methods for counting.
Science Struck
Science Struck: Color Spectrum Chart With Frequencies and Wavelengths
Read about the visible light spectrum and learn the frequencies and wavelengths for each of the primary and secondary colors.
ClassFlow
Class Flow: Cumulative Frequency Data Handling
[Free Registration/Login Required] Students draw conclusions and engage in tables and charts involving cumulative frequency; a wonderful review of student's knowledge.
BBC
Bbc: Representing Data
This BBC Math Bite tutorial for line graphs, pictograms, and frequency polygons features an exam in which students draw and interpret statistical diagrams.
PBS
Pbs Mathline: Whirlybirds [Pdf]
This engaging lesson combines the concepts of statistics and measurement. Learners create a simulation of a parachute jump using whirlybirds, to predict the frequency of an event occurring. A detailed lesson plan which includes a list of...
CK-12 Foundation
Ck 12: Statistics: Histograms Grades 9 10
[Free Registration/Login may be required to access all resource tools.] Make a histogram given a frequency table.
Beacon Learning Center
Beacon Learning Center: Leap Frog Experiment
Students design an experiment, collect information using tree diagrams, and interpret the results using charts in this interactive web lesson.
E-learning for Kids
E Learning for Kids: Math: Tea Store: Reading a Table
Students will demonstrate how to interpret information in a table.
Curated OER
Frequency Chart
Explanation of various keyboard tunings, and why modern Western music uses "equal temperament."
Math Is Fun
Math Is Fun: How to Do a Survey
A clear explanation of how to plan and conduct a survey, then tabulate and display your results.
Other
Ask Numbers: Measurement Conversion Calculators and Charts
What kind of unit conversion would you like to do? This site will allow you to do a multitude of conversions. Just click on the specific measurement you are needing to convert. It also provides a history of measurements and a chart of...
Richland Community College
Richland Community College: Stats Graphs Defined
Richland Community College provides a glossary of many terms that are needed in order to understand statistics graphs and charts. Each of the types of charts is quickly explained in terms of what it is most effective in displaying.
Department of Defense
Do Dea: The Plagiarism Spectrum
The Plagiarism Spectrum identifies 10 types of plagiarism. View this chart which tags each type with an easy to remember digital moniker, definition, rank by severity, and score by frequency of appearance.
Other popular searches
- Tally Charts
- Tally Charts and Pictographs
- Tally Charts and Tables
- Tally Charts or Pictographs.
- Math Tally Charts
- Primary Tally Charts
- Sorting and Tally Charts
- Tally Charts Mode
- Using Tally Charts
- Lucky Charms Tally Charts
- Birthday Tally Charts
- Tally Charts Lesson Plans


