Curated OER
Pets All Around
In this information table activity, learners will survey their classmates to find out what types of pets they have at home and record the information using tally marks on a table. Then students will answer 6 short questions about the...
Curated OER
Survey: What Shape Has More In the Lucky Charms Box?
In this Lucky Charms worksheet, students identify the shapes in the box, and using tally marks, count how many of each shape are included. This worksheet may be used in elementary grades, for counting and tally purposes, but it also can...
Curated OER
THE GULF STREAM
Students explore how to describe the Gulf Stream, how Benjamin Franklin charted it, and correctly plot it on a map.
Actis
Handling Data: Probability, Tree Diagrams
Clean, but captivating, two online simulations demonstrate probability for middle schoolers. They can choose the number of coins and tosses and watch as the results pile up. They can choose from a variety of spinner types and the number...
Curated OER
Climate Change And Disease
Students consider the role of climate change in the occurrence of vector born diseases such as malaria. In small groups, they research a specific vector to complete an information chart on climate changes in the region where the vector...
Curated OER
Scrabble
For this frequency worksheet, students use the standard rules for Scrabble to find the abbreviations used on the board. Then, the determine the frequency as stated in the chart shown to represent the correct number of letter tiles.
Curated OER
Organizing and Interpreting Data
In this organizing and interpreting data worksheet, students solve and complete 10 different problems related to reading various data tables. First, they complete the 3 charts shown with the correct tally amount, frequency amount, and...
Curated OER
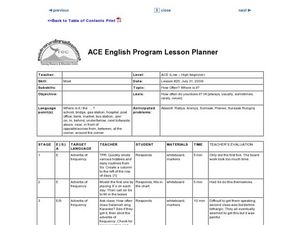
How Often? Where is it?
Learners explore language arts by completing vocabulary worksheets. In this directions lesson, students identify terms and vocabulary words which assist in finding locations and giving directions. Learners complete a worksheet about the...
Curated OER
The Acetate Animal Hunt
High schoolers determine which adaptations allow an organism to survive and reproduce in a certain environment. Students act as "predators" to pick up acetate discs "prey" scattered around the classroom. High schoolers list the number...
Curated OER
Properties of Light
In this light waves worksheet, students will measure the wavelength of different light waves and then calculate its frequency. This worksheet has 9 short answer questions and 10 fill in the blank questions.
Curated OER
Birthdays Survey and Tally List
In this birthday tallying worksheet, students survey classmates and fill out a tally chart of what day every person's birthday is on. Students also make a tally chart about birthday months and years. This page is intended to be an online...
Curated OER
Mira: Activity 10
Students read the story, Mira and then draw a picture of their favorite weather using the story as a background. They post their pictures around the room and make a tally chart of the number of pictures that were drawn with various...
Curated OER
Graph Lab
Seventh graders explore bar graphs and pie charts. Given a pack of M&Ms, 7th graders explore the colors, sort the data in a frequency chart and then construct bar graphs and pie charts to categorize the M&Ms by color. Students...
Curated OER
Fair Play- Probability Worksheet
In this fair play probability worksheet, 4th graders use the given spinner to determine how many times a student will land on a vowel if they spin 18 times. They toss number cubes 20 times and complete a tally chart that shows the number...
Curated OER
Mode, Median, and Mean
In this measures of central tendency worksheet, students determine the mode, median, and mean of a given data set based on children's test scores. They fill in a tally chart and answer 6 questions based on the data.
Curated OER
Integrated Algebra Practice: Frequency Histograms, Bar Graphs and Tables
In this graphs worksheet, students solve 4 problems about histograms, bar graphs, and tables. Students answer questions about histograms, bar graphs, and tables.
Curated OER
Evolution and Gene Frequencies: A Game of Survival and Reproductife Success
Students research the population of Bengal tigers and their existence as either dominant or recessive. They explore the presence of fur on these tigers and its lethal combinations. Determinating the effect of random mating in a...
Curated OER
Tally Marks
In this mathematical activity, students practice mastering the concept of keeping up with tally marks in a variety of activities. Students complete a survey involving tally marks.
Curated OER
Frequency Words
First graders use a graph to answer questions about the frequency of words. Using rhymes, they fill in a chart about the data they collected. In groups, they use their word wall words to identify them in a book.
Curated OER
Tallying Animals
Second graders draw a picture of a pond scene which includes various animals. They exchange pictures and tally the number of animals drawn. Then they record the number on a chart and write a story about their pictures.
Curated OER
Tossing a Number Cube-- Tally Marks
In this math worksheet, students investigate probability by tossing a number cube 20 times and recording the times that it lands on each number. Tally marks are used to record data. Students then participate in an experiment in...
Curated OER
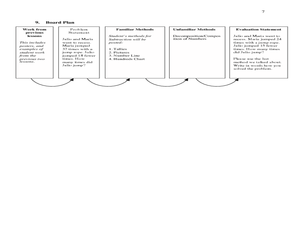
Mathematics Lesson Plan
Second graders study subtraction facts. In this mathematics instructional activity, 2nd graders discuss how to solve two digit subtraction problems. Students recognize that there are many different methods or strategies one can use such...
Pennsylvania Department of Education
Freckle Face
Students collect and record data. For this early data analysis lesson, students gather data about their partners face. As a class, the students use tally marks and pictographs to record the data and answer question about the information...
Curated OER
Pictograms
Have your class practice using a pictogram with this resource. Learners count tally marks, and answer a few questions related to the graph. Afterwards, they could create their own pictograms.
Other popular searches
- Tally Charts
- Tally Charts and Pictographs
- Tally Charts and Tables
- Tally Charts or Pictographs.
- Math Tally Charts
- Primary Tally Charts
- Sorting and Tally Charts
- Tally Charts Mode
- Using Tally Charts
- Lucky Charms Tally Charts
- Birthday Tally Charts
- Tally Charts Lesson Plans


