Curated OER
Excel Lesson Plan Coin Statistics
Second graders determine the difference between making a prediction and determining actual information. They design a spreadsheet for a coin flipping activity on which they include their predictions and what actual happens when they flip...
Curated OER
Creating Tables and Bar Charts
A great way to introduce the concepts of data collection, bar charts, and data analysis. Learners see how their teacher used the data from fifty of her friends to construct a bar chart showing their favorite toys.
Curated OER
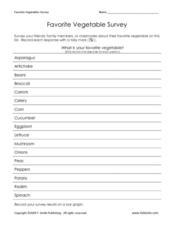
Favorite Vegetable Survey
What's your favorite? Use this chart template in your lesson on data collection and graphing. Learners record classmates' favorite vegetable in a survey, and then graph the results. A labelled graph is provided here- print both pages...
Curated OER
Recording Frequency
First graders analyze nursery rhymes and gather data about word frequency. In this frequency lesson plan, 1st graders create graphs and tables. Students interpret the data.
Curated OER
Math: Graphs and Their Symbols
Second graders examine different types of graphs and discover the meanings of the symbols used on them. After gathering data about themselves, their communities, and the world, they use that information to create graphs. Among the...
Curated OER
Bird Probability
In this bird probability worksheet, students complete 12 different problems and short answer questions related to various types of birds. First, they determine what types of birds live in their forest by using the given table to record...
Curated OER
Heads or Tails?
In this probability worksheet, 1st graders toss a penny in the air 5 times and fill in a chart on how many times it landed heads up and/or tails up. Students complete this activity three times.
Curated OER
Pancakes, Anyone?
First graders explore data collecting and graphing. In this data collecting and graping lesson, 1st graders watch a video about monster who sells pancakes. Students make a graph to record the most popular pancake. Students also play...
Curated OER
All About Graphs
Students practice organizing data by creating graphs. In this statistics instructional activity, students survey the class about favorite colors and create a bar graph using the data. Students complete a test based on pet and animal...
Curated OER
Galluping Away
Pupils use Gallop Poll results to explore causes and effects of the concerns of Americans in the past. They administer a similar poll and consider what Americans in their community view as the most pressing problems in the United States...
Curated OER
Clean up the Money!
In this money worksheet, students fill up a grid with coins and then roll dice to get ordered pairs and take the money of the ordered pair that they roll. Students then add up their money in the end and see who wins.
Primary National Strategy
Ordering and Counting
Are you in need of a 5-day unit intended to teach little learners how to count to 20? This is a well-structured complete set of lessons which employ a variety of methods to instruct learners about various ways to count from 1 to 20. They...
Curated OER
Measuring Volume/Capacity Using the Metric System
There is more than one way to measure an amount, as learners discover by applying multiple measurement tools in these activities. Centimeter cubes, cylinders, beakers, and measuring cups are used to find the volume of regular and...
Curated OER
Stone Soup
Students create a list of ingredients after counting the ingredients in Stone Soup.
Curated OER
Pumpkin Seed Experiment
For this unique lesson pupils participate in a pumpkin seed experiment. Students interact with the pumpkins weight, seeds and record their findings of what lies within the pumpkin once the top of the pumpkin is cut off for observations....
Curated OER
Plastic Parade: Recycling
In this recycling worksheet, students use ten plastic containers, collect data on the recycle number on each one, and conclude if most plastics are or are not recyclable in their town.
Curated OER
Oreo Math
In this Oreo math worksheet, students with a partner practice stacking Oreo cookies twice and predicting how many they can stack up before they fall.
Curated OER
Collecting And Organizing Data
In this collecting and organizing data worksheet, students, with a partner, problem solve and calculate the answers to six mathematical word problems.
Curated OER
Range and Mode
Students interpret data from graphs. In this range and mode lesson, students review a tally chart, pictograph and bar graph. Students use these graphs to calculate the range and mode of each set of data.
Curated OER
Creating Graphs from Tables
Students interpret data from tables and then create a graph to show the same data in a different organization.
Curated OER
Probability With a Random Drawing
Students define probability, and predict, record, and discuss outcomes from a random drawing, then identify most likely and least likely outcomes. They conduct a random drawing, record the data on a data chart, analyze the data, and...
Curated OER
Data Collection - Primary Poster
Students explore the concept of collecting, analyzing, and graphing data. For this collecting, analyzing, and graphing data lesson, students create a survey about a topic of interest. Students poll their classmates, analyze, and graph...
Curated OER
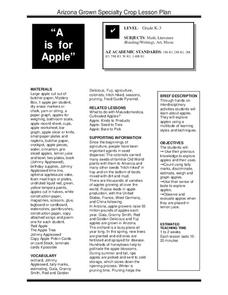
A is for Apple
Learners participate in a variety of activities to learn about apples. Students graph apples, learn about apple uses, taste apples, and observe what happens when apples are dipped in lemon juice.
Curated OER
Organising Data
Students complete data organization activities. In this data organization lesson plan, students watch online clips about organizing data. Students complete an eye color frequency table for their class. Students watch a clip about asking...
Other popular searches
- Tally Marks Graph
- Math Tally Marks
- Graphing With Tally Marks
- Smart Board Tally Marks
- Math Tally Marks
- Tally Marks Lesson
- Tally Marks and Charts
- Counting Using Tally Marks
- Tally Marks and Frequency
- Probability Tally Marks
- Record Data Using Tally Marks
- Survey/ Tally Marks


