Curated OER
Chances And Tallying
In this graphing worksheet, 2nd graders use tally marks for a coin toss. Students respond to 5 questions about their chart and outcomes.
Mathed Up!
Tallys and Charts
After watching a brief instructional video, young mathematicians are put to the test. By completing and reading frequency tables, tally charts, and bar graphs, individuals show their understanding of how to interpret data.
Curated OER
Pictograms
Have your class practice using a pictogram with this resource. Learners count tally marks, and answer a few questions related to the graph. Afterwards, they could create their own pictograms.
Curated OER
Tally Marks Activity
In this tally marks worksheet, students write tally marks for object shown. A reference web site is given.
Pennsylvania Department of Education
Freckle Face
Students collect and record data. For this early data analysis lesson, students gather data about their partners face. As a class, the students use tally marks and pictographs to record the data and answer question about the information...
Curated OER
Holiday Tally
In this tally chart worksheet, students ask ten friends which of 3 holidays they like best. Students create a tally chart with their results and answer 6 questions.
Curated OER
My Test Book: Tally Charts
In this online interactive math worksheet, students solve 10 problems that require them to read and interpret tally chart data. Students may submit their answers to be scored.
Curated OER
Frequency Tables; Discrete Ungrouped Data
In this frequency tables worksheet, students utilize given data to work out three frequency charts with one containing values and a pie chart involving angles for each value. Students complete three vertical line diagrams and check all...
Curated OER
Survey: What is Your Favorite Rainforest Animal?
In this favorite rainforest animal survey worksheet, 1st graders will survey their classmates about which animal is their favorite. There are 12 animal choices. Students will record responses by making tally marks.
Curated OER
Recording Frequency
First graders analyze nursery rhymes and gather data about word frequency. In this frequency lesson plan, 1st graders create graphs and tables. Students interpret the data.
Curated OER
Survey and Tally
Second graders view a model of a survey and tally. In this survey and tally lesson, 2nd graders decide on questions for a survey. Students conduct the survey and tally their results. Students create a tally chart....
Curated OER
Mathematics Lesson Plan
Second graders study subtraction facts. In this mathematics instructional activity, 2nd graders discuss how to solve two digit subtraction problems. Students recognize that there are many different methods or strategies one can use such...
Curated OER
Tally Charts
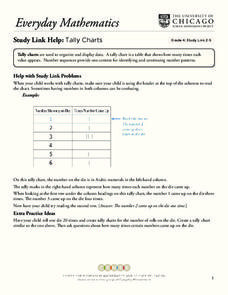
In this tally charts worksheet, students discuss how to use a tally chart and how to read the chart. Once students record information on a tally chart they answer questions showing their ability to read a tally chart.
Curated OER
Make a Tally
In this tally chart learning exercise, students read the word problems and use the information within the problem to make a tally chart. Students use the tally charts to help them finish and solve the word problem.
Curated OER
Collect and Organize Data - Practice 14.1
In this data collection worksheet, students read the word problem and study the tally chart about favorite sports. Students then use the information in the chart to answer the questions. Students then use the list about students'...
Curated OER
Tally Time
Learners create a tally chart. In this math and health instructional activity, students discuss healthy foods and create a tally chart showing the number of learners who like to eat healthy foods.
Curated OER
Organizing Data
Third graders investigate ways to organize data. In this tally marking lesson plan, 3rd graders practice drawing tally marks to represent an item of data. Students also make connections with skip counting by fives.
Curated OER
Tallying Animals
Second graders draw a picture of a pond scene which includes various animals. They exchange pictures and tally the number of animals drawn. Then they record the number on a chart and write a story about their pictures.
Curated OER
Graphing With Candy
Students gather information and interpret the results using a tally chart, a table, and a bar graph.
Curated OER
Classy Fractions
In this fractions worksheet, students find the total numbers of students in their class and ask each student 7 questions provided. Students make a tally chart to record the responses and calculate the fraction of the class that answered...
Curated OER
Birthdays Survey and Tally List
In this birthday tallying worksheet, students survey classmates and fill out a tally chart of what day every person's birthday is on. Students also make a tally chart about birthday months and years. This page is intended to be an online...
Curated OER
Thanksgiving Math
In this Thanksgiving theme math practice, students count turkeys and tally. In this fill in the blank worksheet, students find three answers.
Curated OER
The Die Is Cast
Second graders use tally marks to tabulate and count the number of times each number on a die is rolled.
Curated OER
My Favorite Book Survey
In this my favorite book survey worksheet, students survey their classmates to find out what books they enjoyed reading the most during the year. Students record their choices and keep tally marks on their data.


