Curated OER
Count the Tally Marks!
How many tallies do you see? Learners examine eighteen sets of tally marks with values from 1-18, writing the number value beside them. Depending on how you want to use this, you may want to cut these out and have learners rearrange them...
Curated OER
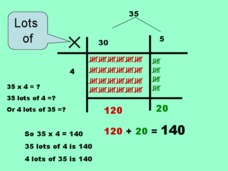
Grid: Multiplication and Tally Marks
I wouldn't say that making and counting tally marks is the best way to solve a multiplication problems, but this PowerPoint may prove me wrong. Kids solve double-digit multiplication problems using a simplistic grid and tally marks. They...
Curated OER
Simple Tally Charts and Bar Graphs
Introduce your first graders to the world of tally marks, bar graphs, and the organization of data. Pupils determine a favorite ice cream flavor based on tally marks, then use a bar graph to answer some questions about sports. There are...
Curated OER
Tallies
Tally Marks are a wonderful way to keep track of data, and to foster counting for your young mathematicians. This resource has learners identify the correct number of tally marks for a given number. The numbers used are: 13, 15, 17, and...
Curated OER
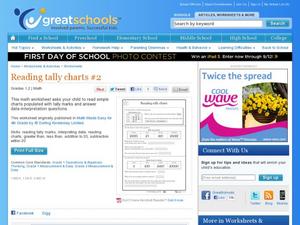
Reading Tally Charts #2
Keep count with tally marks! First graders practice reading tally marks with this straightforward learning exercise. They work with interpreting data from a chart, as well as working with addition and subtraction under 20. A great math...
Curated OER
Tally Marks
In this mathematical worksheet, students practice mastering the concept of keeping up with tally marks in a variety of activities. Students complete a survey involving tally marks.
Curated OER
Tossing a Number Cube-- Tally Marks
In this math worksheet, students investigate probability by tossing a number cube 20 times and recording the times that it lands on each number. Tally marks are used to record data. Students then participate in an experiment in...
Curated OER
Going Graph-y
Second graders listen to and dicuss the story Where the Wild Things Are. They play a pantomime game and act out various feelings so their classmates can guess. They listen for the frequency of certain words, and record their findings on...
Curated OER
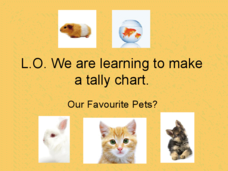
Pet Tally
Give the class an opportunity to practice using tally marks as a way to collect data. As you progress through the slide show, learners tally up the number and types of pets they see, they then use their data to create a tally chart....
Curated OER
Tally and Graph
In this survey and graphing worksheet, students take a survey of 10 friends by asking them to vote for their favorite musical instrument. They fill in a tally chart, track the tally marks, and develop a bar graph with the information.
Curated OER
Build a Bar Graph
Learners discover how to use bar graphs. They will gather and organize specific data in order to put it into a bar graph. Then they will answer several questions based on the information they have graphed.
Curated OER
Count the Tally Marks
In this counting skills worksheet, students examine 6 set of tally marks, count each of the sets, and record the number in each of the sets.
Curated OER
Survey: What Shape Has More In the Lucky Charms Box?
In this Lucky Charms instructional activity, students identify the shapes in the box, and using tally marks, count how many of each shape are included. This instructional activity may be used in elementary grades, for counting and tally...
Curated OER
Pets All Around
In this information table worksheet, students will survey their classmates to find out what types of pets they have at home and record the information using tally marks on a table. Then students will answer 6 short questions about the...
Curated OER
Graphing
Intended for a faith-based classroom, this lesson requires second graders to create a survey, conduct the survey in multiple classrooms, and graph the results. They can choose between creating a picture or bar graph, or you can require...
Curated OER
Creating Tables and Bar Charts
A great way to introduce the concepts of data collection, bar charts, and data analysis. Learners see how their teacher used the data from fifty of her friends to construct a bar chart showing their favorite toys.
Curated OER
Tables and Graphs
Help pupils read graphs and tables with these examples and data comprehension questions. First they examine a bar graph to answer five analysis prompts. Note this graph doesn't have a label along the y-axis, so you may want to do this...
Curated OER
Tallies Tell It All
Students explore data collection through the use of tally marks. After a demonstration of the use of tally marks students complete various inquires where they create a chart documenting the number of times a desired result happens. They...
Curated OER
Count and Tally
For this counting skills worksheet, students respond to 4 questions that require them to count items pictured and use tally marks to total them.
Curated OER
Dinosaur Tally
In this counting instructional activity, students count the number of dinosaurs pictured in 6 examples. They use tally marks to show how many objects are in each box.
Curated OER
Chances And Tallying
In this graphing learning exercise, 2nd graders use tally marks for a coin toss. Students respond to 5 questions about their chart and outcomes.
Curated OER
Count and Tally 2
In this counting skills worksheet, students respond to 6 questions that require them to count items pictured and use tally marks to total them.
Mathed Up!
Tallys and Charts
After watching a brief instructional video, young mathematicians are put to the test. By completing and reading frequency tables, tally charts, and bar graphs, individuals show their understanding of how to interpret data.
Curated OER
Bar Graphs with Tally Marks
Students classify buttons into categories, create and interpret a tally table and bar graph, and add and subtract numbers.


