Curated OER
Buzzing is BEE-lieving
Students investigate insects. In this insect lesson, students explore various insect models and identify the characteristics of each. Students observe insects outside and tally how many insects they observe.
Curated OER
Recording Frequency
First graders analyze nursery rhymes and gather data about word frequency. In this frequency lesson, 1st graders create graphs and tables. Students interpret the data.
Curated OER
Graphing With Candy
Students gather information and interpret the results using a tally chart, a table, and a bar graph.
Curated OER
Comparing Data on Graph A and Graph B
Second graders gather and graph data. In this graphing lesson, 2nd graders collect data and graph this information using tally charts, bar graphs, pictographs, or tables. They make predictions about the outcomes.
Curated OER
Investigation: Reasoning and Proof
Students explore animal characteristics by creating illustrations. In this animal identification lesson, students read a list of animal descriptions which they draw using crayons or colored pencils. Students view their drawings and...
Curated OER
All About Graphs
Students practice organizing data by creating graphs. For this statistics lesson, students survey the class about favorite colors and create a bar graph using the data. Students complete a test based on pet and animal statistics.
Curated OER
Voting
Second graders discuss with the class their favorite Thanksgiving foods. The teacher will write responses from four students on the board and the students then will vote for their favorite Thanksgiving food on a folded sheet of paper....
Curated OER
Math: Counting on Others
Students use counting skills to decide who wins the Classroom Winter Games. They use numeral writing and tally marks to keep score. Students have an opportunity to pretend they are competing for medals in the Winter Games while using...
Curated OER
Math on a Roll
Young scholars practice various math skills using a polyhedral die. In this dice game lesson plan, students practice multiplication, addition, place value, and money using games. Standard dice may be used instead of a polyhedral die...
Illustrative Mathematics
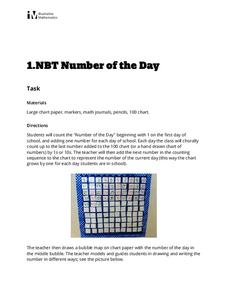
Number of the Day
Daily routines not only help to manage classrooms, they can also provide students with rich opportunities for learning. This activity supports young learners in developing their number sense by counting up the school days on a class 100...
Curated OER
Importance of Marine Protected Areas: an Overfishing Simulation
Students simulate overfishing by conducting a guided experiment in the classroom. In this ecology lesson, students discuss the environmental consequences of overfishing. They research additional information about the issue and share...
Curated OER
Inheritance in Maize
Students use mutant corn ears to investigate inheritance patterns. In this inheritance lesson plan, students count the number of corn kernels of each phenotype in mutant and wild type ears of corn. Students calculate the ratio of...
Curated OER
Pumpkin Seed Experiment
In this unique lesson students participate in a pumpkin seed experiment. Students interact with the pumpkins weight, seeds and record their findings of what lies within the pumpkin once the top of the pumpkin is cut off for observations....
Curated OER
Range and Mode
Students interpret data from graphs. In this range and mode lesson, students review a tally chart, pictograph and bar graph. Students use these graphs to calculate the range and mode of each set of data.
Curated OER
Organising Data
Students complete data organization activities. In this data organization lesson, students watch online clips about organizing data. Students complete an eye color frequency table for their class. Students watch a clip about asking...
Curated OER
Data Collection - Primary Poster
Students explore the concept of collecting, analyzing, and graphing data. In this collecting, analyzing, and graphing data lesson, students create a survey about a topic of interest. Students poll their classmates, analyze, and graph...
Curated OER
Valentine's Day Math
First graders explore sorting and classifying. In this math lesson, 1st graders sort conversation hearts based on color. Students graph their results and enjoy the candy!
Curated OER
What Part of the Earth's Surface is Covered by Oceans?
Third graders investigate oceans. In this Earth science instructional activity, 3rd graders predict how much of the Earth's surface is covered by oceans. Students determine if their predictions are accurate by throwing a globe to each...
Pennsylvania Department of Education
Up on Top
Students make bar graphs and identify items in the bar graphs as being likely, certain, or impossible. In this bar graphs lesson plan, students answer questions about the bar graphs using reasoning and communication skills.
Curated OER
States On A Map
Third graders locate the states of Main and Kansas on a map. In this state location lesson plan, 3rd graders read the book Sarah, Plain and Tall and discuss what states she traveled through.
Curated OER
Circle Graphs
Sixth graders participate in a lesson that covers the reading and interpretation of a circle graph. They review the part of a whole concept for percents and student observe and practice using the circle graph.
Curated OER
Taste Test
Third graders practice creating bar graphs by conducting a taste test. In this graphing activity, 3rd graders taste several different brands of peanut butter and discuss among their classmates which tastes better. Students create a bar...
Curated OER
Calendar Communication
Students identify days, dates, and month on a calendar. In this calendar instructional activity, students use a blank calendar page and fill in the days of the month. Students recall what they learned on specific days and record that...
Curated OER
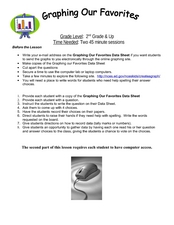
Graphing Our Favorites
Second graders use a computer program to follow directions and graph their favorite things into a bar graph. In this graphing lesson plan, 2nd graders have 30 choices of favorite things to graph.


