Math Is Fun
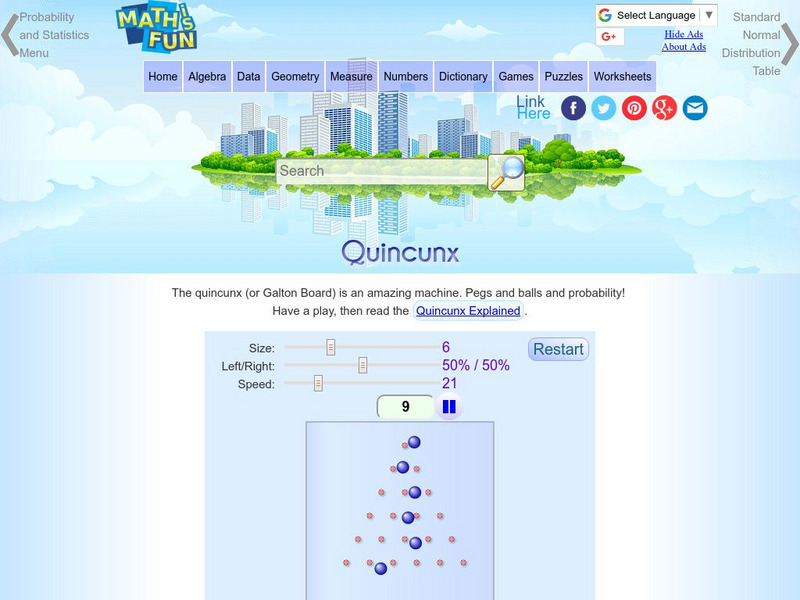
Math Is Fun: Quincunx
The Quincunx is a fascinating probability machine that demonstrates how distribution works. This page has an interactive Quincunx where you can adjust how many rows there are for the balls to bounce down when dropped. A link takes you to...
Annenberg Foundation
Annenberg Learner: Against All Odds: Inside Statistics
The video series shows students the relevance of statistics in real-world settings. The resource includes 26 half-hour videos. Topics include normal distributions, probability, random variables, experimental design, and describing data.
University of Cambridge
University of Cambridge: Maths and Sports: Who's the Best?
Can you use data from the 2008 Beijing Olympics medal tables to decide which country has the most naturally athletic population? This data-handling activity encourages mathematical investigation and discussion and is designed to be...
Sophia Learning
Sophia: Practical Applications of the Bell Shaped Curve
Explore the bell-shaped curve and how to calculate a z score. Additional links provided to further knowledge on outliers.
Texas Education Agency
Texas Gateway: Data, Sampling, and Variation in Data and Sampling
This learning module discusses quantitative and qualitative data, the use of two-way tables in marginal and conditional distributions, how to display data, variation in data and samples, and how to critically evaluate statistical...
Missouri State University
Missouri State U.: Introductory Statistics: T Test: One and Two Tailed T Tests
One-tail and two-tail t-distribution tests are explained here in detail. When is one the preferred method? A good comparison is offered.
Other
Fayetteville State University: Z Scores and Probability
Several paragraphs of explanation and graphs are found here to get across the concept of normal scores, z-scores, and the related probability in a simple fashion. This page is part of a collection from the university on basic statistical...
Texas Education Agency
Texas Gateway: Tea Statistics: Confidence Intervals: Practice
A large collection of practice problems on confidence intervals.
Khan Academy
Khan Academy: Empirical Rule
Practice applying the 68-95-99.7 empirical rule. Students receive immediate feedback and have the opportunity to try questions repeatedly, watch a video or receive hints.
Texas Instruments
Texas Instruments: Using Derive
In this activity, students use the Derive software to solve trigonometric equations, expressions with exponentials, and log equations. They also determine the equation of tangent and normal of a function; evaluate integrals, find area...
Texas Instruments
Texas Instruments: Central Limit Theorem
This set contains questions regarding the Central Limit Theorem. The student sees that, as the size n increases, the shape of the sampling distribution gradually approaches a normal curve, and its population standard deviation decreases.
Stefan Warner and Steven R. Costenoble
Finite Mathematics & Applied Calculus: Topic Summaries: Statistics
The topic summary outlines random variables and statistics. Some topics reviewed are normal distribution, Bernoulli trials, measures of central tendency, and variance. The resource consists of definitions, notes, and examples.
CK-12 Foundation
Ck 12: Statistics: Variance of a Data Set
[Free Registration/Login may be required to access all resource tools.] Covers the variance for a normally distributed random variable.
CK-12 Foundation
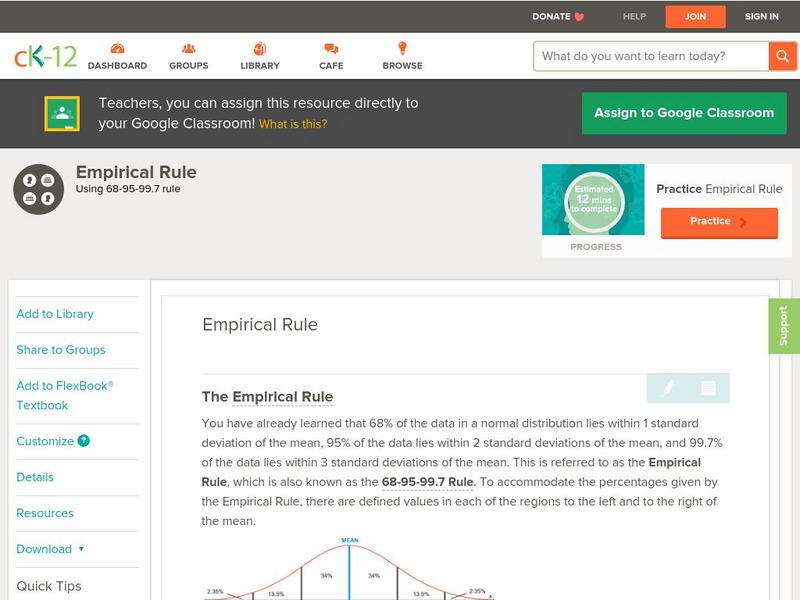
Ck 12: Probability: Empirical Rule
[Free Registration/Login may be required to access all resource tools.] Use percentages associated with normal distributions to solve problems.
CK-12 Foundation
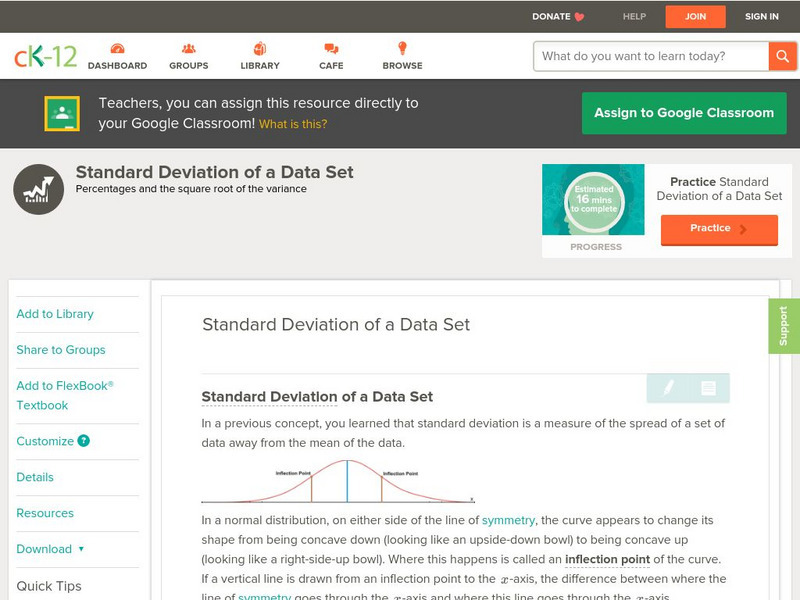
Ck 12: Statistics: Standard Deviation of a Data Set
[Free Registration/Login may be required to access all resource tools.] Learn about standard deviation of normally distributed data.
Vision Learning
Visionlearning: Statistics: Using Mean, Median, and Standard Deviation
An introduction to recognizing trends and relationships in data through descriptive statistics.
EngageNY
Engage Ny: Lesson 19: Analyzing Decisions and Strategies Using Probability
In this lesson, students compare strategies by evaluating the associated probabilities of success. Additionally, problems are included where students are asked whether the result of a probability experiment provides sufficient evidence...
Khan Academy
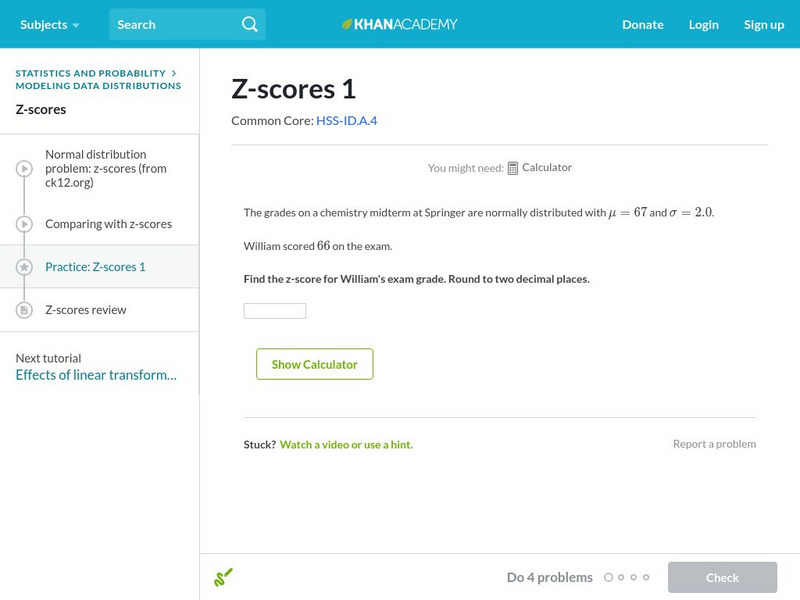
Khan Academy: Z Scores 1
Find the z-score of a particular measurement given the mean and standard deviation. Students receive immediate feedback and have the opportunity to try questions repeatedly, watch a video or receive hints.
CK-12 Foundation
Ck 12: Statistics: Applications of Variance and Standard Deviation
[Free Registration/Login may be required to access all resource tools.] Calculate the variance and standard deviation of a data set.
University of Cambridge
University of Cambridge: Maths and Sports: Olympic Triathlon
Do you think the triathlon will be won by someone who is very strong in one event and average in the other two, or someone who is strong in all three disciplines? This activity challenges students to analyse real-life data and use their...
Mathigon
Mathigon: Probability and Discrete Math: Predicting the Future
This lesson focuses on probability theory for predicting the outcome of flipping a coin, and then flipping it multiple times.
Shodor Education Foundation
Shodor Interactivate: Overlapping Gaussians
In this applet you can adjust the parameters on two Gaussian curves to determine if there is a possibility of a difference between the two means.
University of Manchester
Umist: Mathematical Formula Tables
This site has links to tables of mathematical formulas. To view them, the student must download the formulas in pdf format.
CK-12 Foundation
Ck 12: Statistics: Sampling Methods Grade 8
[Free Registration/Login may be required to access all resource tools.] Understanding survey data and methods of sampling.
