Curated OER
Human Face of Mathematics - Mathematics in Aboriginal Culture
Young scholars collect statistical data. In groups, students play a dart game and then determine the distance between darts. They collect the data and plot the information on a coordinate plane. They identify the mean and the standard...
Curated OER
Bell Curve
Students explain normal distribution of a measurable characteristic within a group of objects. They create two graphs (one for each type of Hershey's Kiss) with increments of measurement on the X-axes and number of measurements on the...
Curated OER
Assessing Normalcy
Students define normal distribution as it relates to the bell curve. In this statistics lesson, students use the central tendencies of mean, median and mode to solve problems. They plot their data and draw conclusion from the graphs.
Concord Consortium
Dubious Dice
How many ways can you slice dice distribution? A short performance task asks pupils to consider different types of distributions. Given histograms showing a triangular distribution and a bimodal distribution, they create pairs of dice...
Curated OER
Human Population- Changes in Survival Rates Data Interpretation
In this human population changes in survival worksheet, students interpret and plot data to understand the differences in human mortality and survivorship between historic and modern times. They investigate how these changes influence...
Curated OER
Area And Perimeter Using Pentominoes
Third graders engage in an enrichment lesson exploring the concepts of area and perimeter. They construct new pentominoes that are 3 times the size of normal ones and then identify the area and perimeter measurements. They then create a...
Curated OER
Transforming Univariate Data
Learners analyze plotted data in this statistics instructional activity. They differentiate between skewed and normal data. They also explore and interconnect exponential growth and decay as it relates to the data.
Curated OER
Data Collection
Pupils investigate qualitative and quantitative data. In this statistics lesson, students gather data on heights and weights of people and graph the distribution. Pupils discuss the differences between qualitative and quantitative data.
Curated OER
The Power of Graphical Display: How to Use Graphs to Justify a Position, Prove a Point, or Mislead the Viewer
Analyze different types of graphs with learners. They conduct a survey and determine the mean, median and mode. They then identify different techniques for collecting data.
Curated OER
Getting the Lead Out
The article for this lesson no longer accessible through the links in the lesson plan, but can be found in the National Center for Biotechnology Information website. After reading it, environmental science young scholars answer questions...
Curated OER
Confidence Intervals: Population Mean; Population Standard Deviation Unknown
In this confidence interval worksheet, students examine given statistical information to find the margin of error. They construct a confidence interval for the population and find the mean. Seven statistical problems are available on...
Curated OER
Z-Scores related to Psychology
In this z-score learning exercise, students identify the z-scores and percentiles corresponding to thirteen values. Students are also asked to find two probabilities. Worked solutions are provided after each question.
Curated OER
As Good As Gold
Students find examples of the Golden Ratio on the human body through measurement. Additionally, students learn about the use of the Golden Ratio and the Golden Rectangle in art and architecture. A very interesting lesson plan for the...
Curated OER
Precalculus Exam
In this precalc lesson, students write out definitions, identify functions, solve integrals and derivatives and graph trig functions as they relate to angles. This is a final exam for precalculus. There are 80 questions on this exam.
Illustrative Mathematics
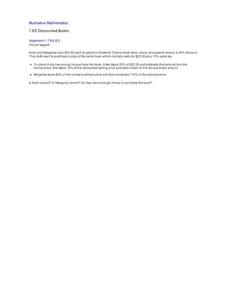
Discounted Books
Adolescents love to shop, especially when an item is discounted. Here, shoppers only have a set amount of money to spend. Will they be able to make a purchase with the discount and tax added in? Percent discounts can be calculated...
MENSA Education & Research Foundation
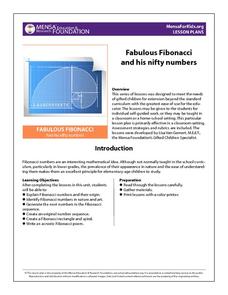
Fabulous Fibonacci and His Nifty Numbers
Fibonacci numbers are not only found in the classroom but also in nature. Explore the concept of Fibonacci numbers through a series of lessons designed to gain insight into the mathematical reasoning behind the number pattern, and spark...
Curated OER
Percentiles
Students analyze the bell curve and make predictions. In this statistics instructional activity, students calculate the percentile to the left of the curve. They then are given the percentile and create the graph from the data.
Curated OER
Z-Scores
Learners solve problems by identifying the percent of area under the curve. In this statistics lesson, students discuss z-scores as they calculate the different percentages under the bell curve. They calculate the standard deviation.
Curated OER
Statistics
High schoolers log their computer usage hours. They determine the mean, median, mode and standard deviation of the collected data. They make a frequency histogram of the grouped data, both on graph paper, and on the TI 83+ graphing...
Curated OER
Bell Curve
Students construct two bell curves using two different yet related objects. For example, two kinds of Hershey's Kisses (plain and almond) or two kinds of dried beans (kidney and lima).
Curated OER
Sampling Rocks
Students examine how to take a sample by looking at rocks in the schoolyard. In this sampling instructional activity, students discuss ways to classify rocks by color, size, and weight. They think about how many rocks would make a good...
Curated OER
What is a P-value?
Young scholars test the hypotheses using p values. In this statistics lesson, students define and examine conditional probability. They test each statement for a true statement or a false statement, based on the sample size.
Curated OER
Bell Curve
Students explore averages by completing a data analysis activity. In this bell curve lesson, students measure different food items and plot their measurements on a X and Y axis. Students create bell curves around the average weight or...
Curated OER
Worksheet 15
In this math instructional activity, students sketch and label on a number line the regions that converge and diverge with the sequences. Then they examine a smooth function and define its series.


