Curated OER
MT-A141Precalculus
In this precalculus worksheet, students examine the three problems critically and they find the solutions for the word problems.
Curated OER
Let's Get Physical
Students collect data using the CBL. In this statistics lesson, students predict the type of graph that will be created based on the type of activity the person does. The graph represents heart rate depending the level of activity.
Curated OER
Means of Growth
Students collect and graph data. In this statistics lesson, students analyze their plotted data using a scatter plot. They identify lines as having positive, negative or no correlation.
Curated OER
Discovering The Ratio Pi And The Diameter
Students relate the ratio of Pi to the diameter of a circle. In this geometry lesson, students investigate the relationship of the chord of the circle the the number Pi. They define ration, chord, circumference and diameter and find...
Curated OER
Hot Wheels
Students observe the action produced by toy cars. In this geometry lesson, students discuss motion and distance as they relate to the movement of a spherical object.They collect data and make conjectures based on their data.
Curated OER
The Fat and the Lean
Students collect data on calorie intake. In this algebra instructional activity, students use the collection of data to make better eating decisions. They investigate the nutritional value in food using a graph and draw conclusion from...
Curated OER
Conductivity of salt Solutions
Students investigate the concentration level of solutions. In this math/science lesson, students identify three different ionic compounds. They predict the conductivity of each using their collected data.
Curated OER
Let's Go Slopey
Students create a table of values to graph a line. In this algebra instructional activity, students identify the slope and intercept of a linear equation. They use a Ticalculator to graph their function.
Curated OER
Burning Snacks in Chem Lab
Learners determine the energy content of various snack foods. They measure the temperature changes in various snack foods as the foods are burned in order to determine the foods' energy content. Students create graphs and data tables of...
Curated OER
Hit Me If You Can!
Learners graph linear equations using slopes and intercepts. In this algebra lesson, students identify the slope as being positive,negative or undefined. They differentiate between different quadrants on a coordinate plane.
Curated OER
Beginning Modeling for Linear and Quadratic Data
Students create models to represent both linear and quadratic equations. In this algebra lesson, students collect data from the real world and analyze it. They graph and differentiate between the two types.
Curated OER
Quadratic Formula
Students factor and solve quadratic equations.In this algebra lesson, students identify the roots of an equation using the quadratic formula. They graph and identify the properties of a parabola.
Curated OER
Batteries in Series
Eighth graders examine batteries in a series circuit and the associated voltage. They determine, through inquiry and problem solving, that the total voltage of batteries in a series is the sum of the voltage of each battery. They design...
Curated OER
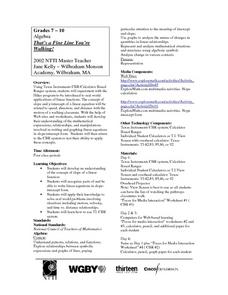
That's a Fine Line You're Walking!
Young scholars experiment with Hiker program to practice real world applications of linear functions and develop their understanding of expressions, relationships, and manipulations involved in writing and graphing linear equations in...
Curated OER
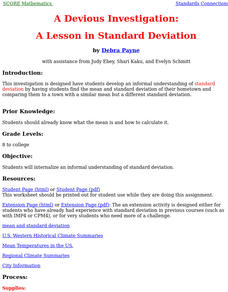
A Lesson In Standard Deviation
Students develop an informal understanding of standard deviation by having students find the mean and standard deviation of their hometown and comparing them to a town with a similar mean but a different standard deviation.
Curated OER
How Much Is Too Much?
Students examine population growth and collect data. In this statistics instructional activity, students create a scatter plot to represent the different species found in the water and are being harvested. They graph their data and draw...
Curated OER
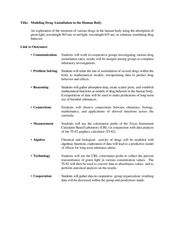
Modeling Drug Assimilation in the Human Body
Learners investigate the accumulation of drugs in the body. In this algebra lesson, students collect data on drug retention and assimilation. They use their data to predict the behavior and effects of drugs.
Curated OER
Round and Round and Round We Go!
Students investigate motion using a CBL. In this algebra lesson, students collect and graph data on a coordinate plane. They define and identify amplitude and period of conic graphs.
Curated OER
The Fuelish Fact Finding
Students define fluctuation and the price of food. In this algebra activity, students create a budget to live on based on their living expenses. They create a chart and explore the cause and effect of real life scenarios.
Curated OER
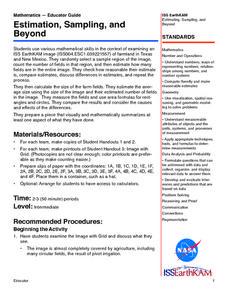
Estimation, Sampling, and Beyond
Students examine an ISS EarthKAM image of farm land in Texas and New Mexico. They select sample region of image and count the number of fields in that region. They estimate how many fields are in the entire region.
Curated OER
Exploring the Stock Market
Students explore their options in stocks. In this algebra lesson, students create a portfolio for their future in stocks. they discuss their choices with a broker and presents their portfolio to the class.
Curated OER
Linking Real World Data to the Classroom
Students analyze data representing real life scenarios.In this algebra lesson, students collect, plot and analyze data using a graph. They use different methods to represent and present their data.
Curated OER
The Absolute Truth
Young scholars solve problems of inequalities and equations. In this algebra lesson, students add, subtract, multiply and divide to solve inequalities. They graph their solutions on a number line.
Curated OER
Monitoring Oxygen Level
Students measure oxygen percentages in room air and air exhaled after they perform various activities. They explore various websites, and record and analyze the data from the experiments.


